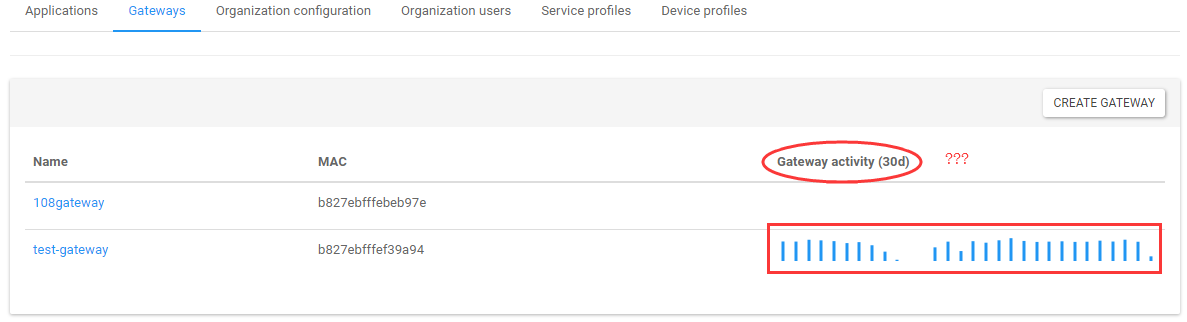
What dose the blue histogram mean, especially their height ?
I want to show this “gateway activity” in my own application, but I can’t find any related API in REST API page.
Is there any other method to achieve my goal ?
Thanks for your answer.
I have another problem, how to get the historical record of gateway activity ?
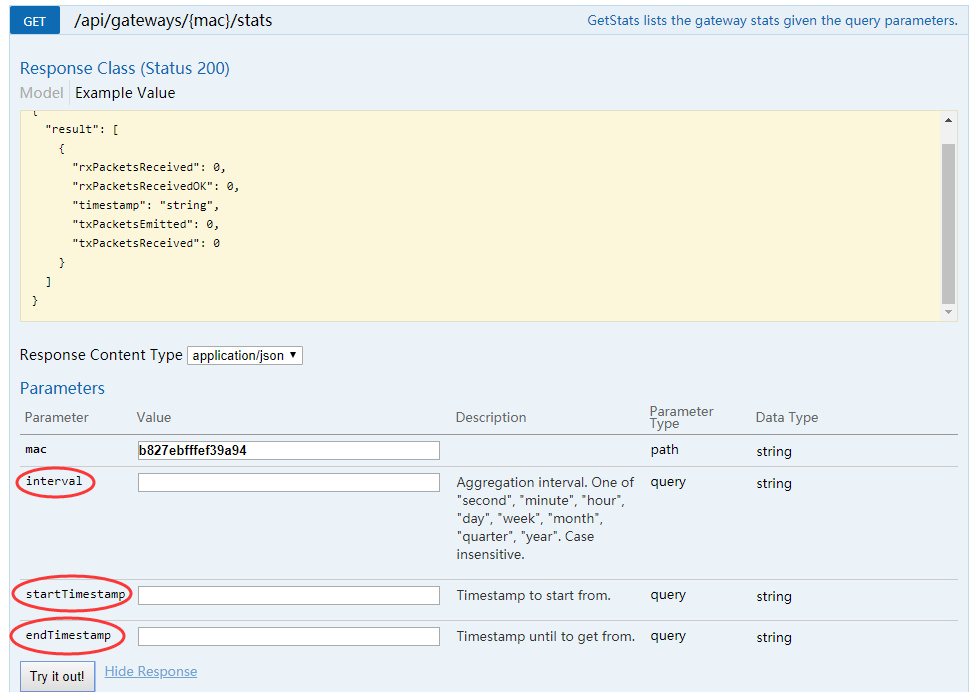
The REST API you provide(/api/gateways/{mac}/stats) only shows the current state.
Sorry, I was wrong.
I can get the historical record of gateway activity by REST API(/api/gateways/{mac}/stats).
I forgot to provide a start and stop timestamp as the following figure show: