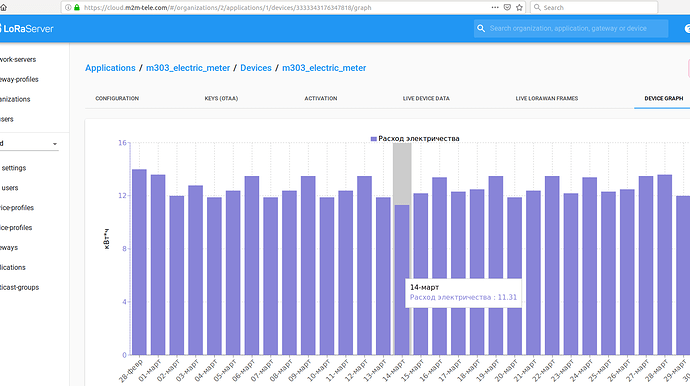
Hi!
When I open lora-app-server I can see only data received later.
What is the proper way to view previously received packets?
If no default way to enable this what is the easiest way to achieve that?
Thank you.
There’s no persistent datastore. You’d either need to use one of the supported database integrations, or add your own.
Or for debugging, something that’s proved very handy is that I have a copy of mosquitto_sub subscribed to the ‘#’ topic (ie, everything) and simply appending to a text file which I can grep and tail - a bit crude, but the literal transcription of the MQTT feed itself means it’s easy to write programs which can either watch live data, or re-examine old data…
Do you mean following:
https://www.loraserver.io/lora-app-server/integrate/sending-receiving/influxdb/
?
So I implemented separate service that listens for MQTT events and store all payloads to Postgresql’s table called ‘payload’.
Then I modified ReactJS code to get additional tab with graphical representation of payload (dummy data at this moment):
So how can I retrieve data from backend to display it in my new tab?
How cat I create new endpoint at existing API?
You’ll have to modify the according proto file or create your own for a new service. In the first case, just run make api; in the latter, remember to add it to gen.sh and register the service at internal/api/external, in functions setupAPI and getJSONGateway, after running make api.
After that you need to implement the logic at the correct internal/external/your-service.go file. On the UI side, just call the endpoint(s) from the proper store.
Hi Almaz,
Can you guide me on how to create a new tab to show sensor data graph using MQTT?
I am struggling to find sample to display sensor data on a new tab.
My sensor data can be found Application->AppB (I name it myself)->ContLashSens3 (I name it myself)->DEVICE DATA tab.
At the DEVICE DATA tab, I need to click to open the UP panel to see my sensor data. It is quite troublesome. I am thinking of creating a new tab to show the sensor data, a graph, at a glance.
Hope to hear from you soon.
Regards,
Nelson
