Receiving LoRaWan frames but not seeing any data

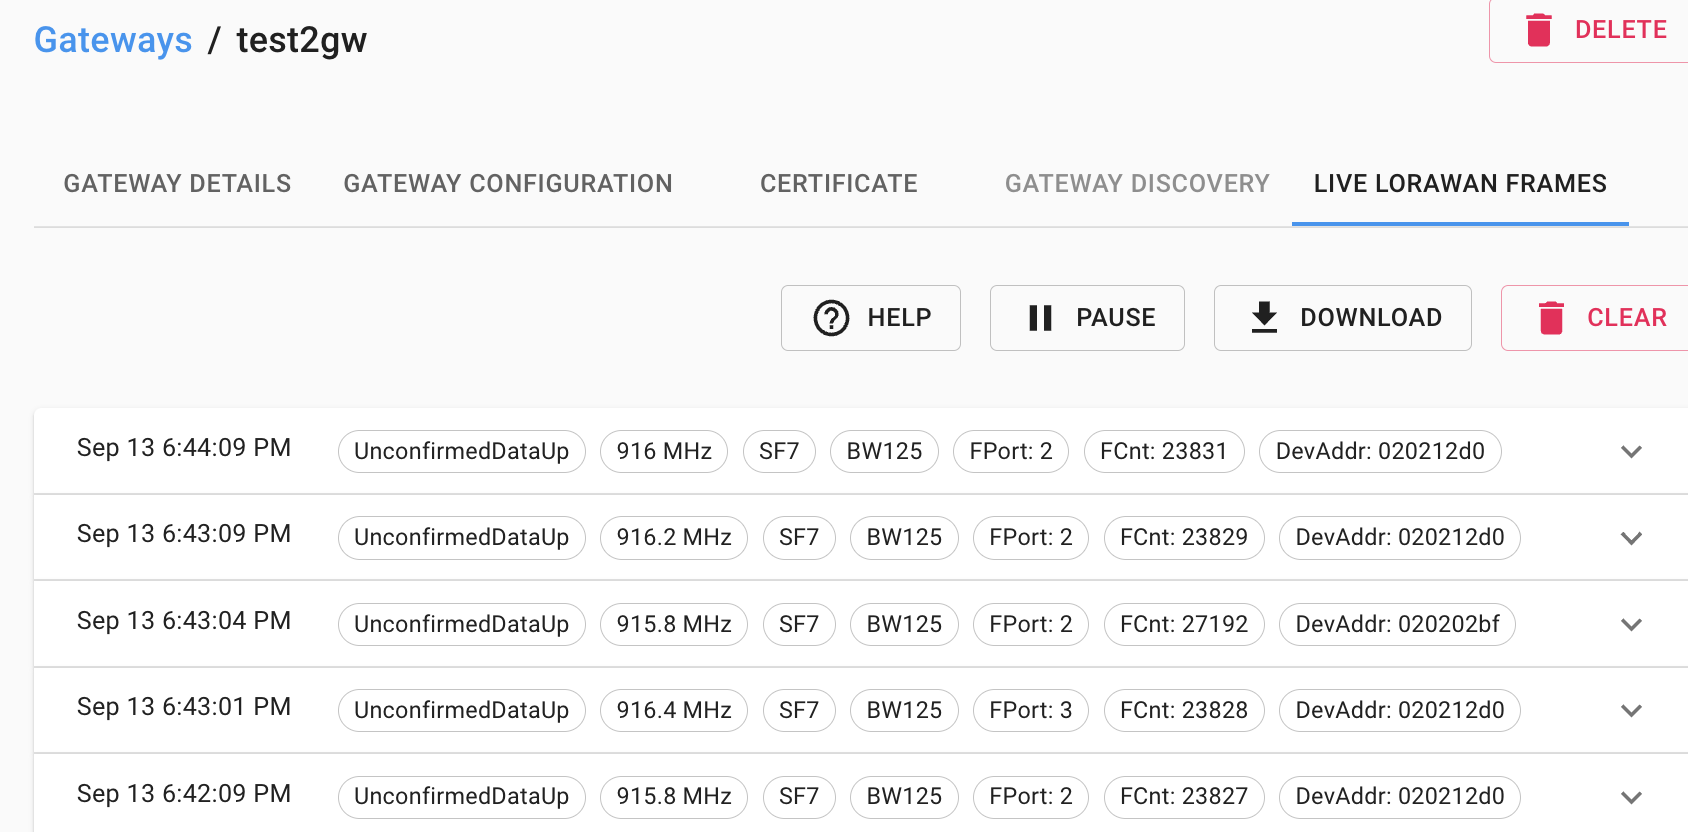
I’ve set up Network and Application server and logs on both are showing no errors, plus I’m seeing LoRaWAN frames in the LIVE LORAWAN FRAMES tab in my Gateway under the Gateways menu in App server. However, GATEWAY DETAILS shows nothing received, and under Active Devices in the Org. Dashboard I’m seeing No data available.

in the config.toml for the Network server I’m using:

  [network_server.band]
  name="AU915"

A couple of screenshots:


What could be the cause for this? I read in another post that it might be related to the network band, but I don’t have anything on that on the Application server config.toml file or in anything I’ve found in the GUI of the Application server.

I have the same problem with Multitech MTCDT-210A - MTAC-LORA-868. I can see the LoRaWAN Frames but the GW Details nothing

One question, the Gateway time is the same of the Chirpstack time? Maybe can be the problem

Not pretty sure, did you solve the problem by your side, we are off on holidays but we will test again next wednesday

@brocaar is possible to take a short look on this please? We are stuck on this for a long time. Thanks in advance :slight_smile:

Same for us. Did you or anyone find the reason/solution?

Did you look into the SYSLOG…???

For CHIRPSTACK V3

  1. Login with PUTTY into your Chirpstack server.

— to validate if chirpstack-gateway-bridge is receiving data from your GW
2. sudo journalctl -a -f -n 100 -u chirpstack-gateway-bridge

— to validate if chirpstack-network-server is receiving data from your node(device)
3. Identify your Device EUI for your node
4. sudo journalctl -a -f -n 100 -u chirpstack-network-server | grep Device EUI

If it can help…

We are using v4.1.1.

Everything works fine, I mean the gateway is sending data from the devices, except that it is marked as “not seen” in the interface.

After looking at the logs, I can see it (00800000a00009b0):

But it seems that no stats packets are received.

The other GW (UG65) runs smoothly.

I’m wondering if it could come from the fact that this old gateway is using a v1.0 USB LORA card…

I forced usage of basic_pkt_fwd-usb but it still doesn’t work (it works indeed, but last seen is still “never” and no stats are received)

That might be the cause. Note that the last seen is driven by the stats, not the last uplink. I’m not sure if the old USB packet-forwarder was sending these stats. As well I’m not sure if it is sending the TX ACK package (in which case you would not see any downlinks in ChirpStack / downlinks will stay in the queue).

1 Like

I confirm it is the cause.

I’m frustrated not being able to recycle those good old gateways :sweat_smile: