Hello,
I’ve just installed Ubuntu 18.04.3 LTS on a virtual machine.
I’ve installed LoRa Gateway Bridge (3.3.0), LoRa Server (3.2.1) and LoRa App Server (3.3.1) and they work.
The only problem is that the SF of the uplink/downlink messages is always 12 and this heavily limits the transmission rate of my devices.
Previously I used a RAK gateway with installed previous versions of LoRa Gateway Bridge, LoRa Server and LoRa App Server and the first uplink/downlink messages were with SF12 and then it automatically became SF7 for all the successive uplink/downlink messages. In this case I was able to transmit each 10 seconds (perfectly fits my need).
My devices run the same firmware.
How can you explain this behavior ? Did I something wrong in the configuration on the new versions of the loraserver.io softwares?
Same issue here. I have loraserver 2.8.2, lora-app-server 2.6.1 and lora-gateway-bridge 2.7.1. with a population of around 130 nodes. Before upgrading to this version. the datarate of all my devices is almost always at 5. Now they all stay at 0. After resetting the node, the dr briefly return to 5, but after 1 or 2 uplink messages they went to 0 immediately. So no intermediate values of dr 4,3,2,1 have been seen.
I can’t remember which version I had before though. My development server seems not to have this problem though (2.3.0, 2.4.0 and 2.6.1 respectively) but the connection will completely fail there when the signal is bad, so it’s either dr 5 or nothing arrives at the server.
It would be very helpful if you could add some debug capability to the node firmware so that you can see when they actually receive a downlink message.
ADR can only keep data rates high if downlink messages are received occasionally - with ADR enabled, they will be sent from time to time even if there is no user data to send in the downlink direction.
I updated my dev server to the latest v2 version (just like my production server), and problem occurs even with just 2 devices. I tried the same device/node and gateway on ttn. No sudden downgrade from dr5 to dr0. So it really seems the newer version doesn’t work with ADR so well. Something changed in the newer versions that’s causing this.
“Something changed” isn’t really a very effective approach to a problem. You have access in both the web gui and the MQTT feed to the behavior of the server by examining the contents, settings, and timing of any downlinks it commands.
Preferably you also have a way to get debug output from a node so you can see it’s behavior.
Right now its not really clear if your node is ever receiving downlinks, and if not, why not.
Leveraging those tools is how problems like this get promptly solved.
We’re using a third-party LORA-device so I can’t really debug the device itself. However, I can confirm that downlinks are working. About half of our messages (20-30 per day on avg) require server acknowledgment and we can configure device by sending confirmed downlinks. All of these are working.
I’m a newb to LORA and have actually other responsibilities as well so I didn’t have the chance to dive deeper into LORA specs. If you have any other suggestions as which logs I can provide that would be very helpful. I have access to the complete back-end of our LORA infrastructure so I can try to look into the gateway/server logs if you can point me to the right direction.
Many thanks!
ADR is controlled by MAC commands encoded in the downlink packets (typically in the fopts field, theoretically also as the body of a message containing no application data).
Additionally if a node doesn’t get any response in a long enough time (as often as not because of misconfiguration) it will ramp back the data rate all by itself.
That’s why its important to look at both the commands in the downlink’s sent, and ideally also the node’s behavior. It’s entirely possible for example that the server has changed between two valid behaviors, but the node does not handle one of them properly.
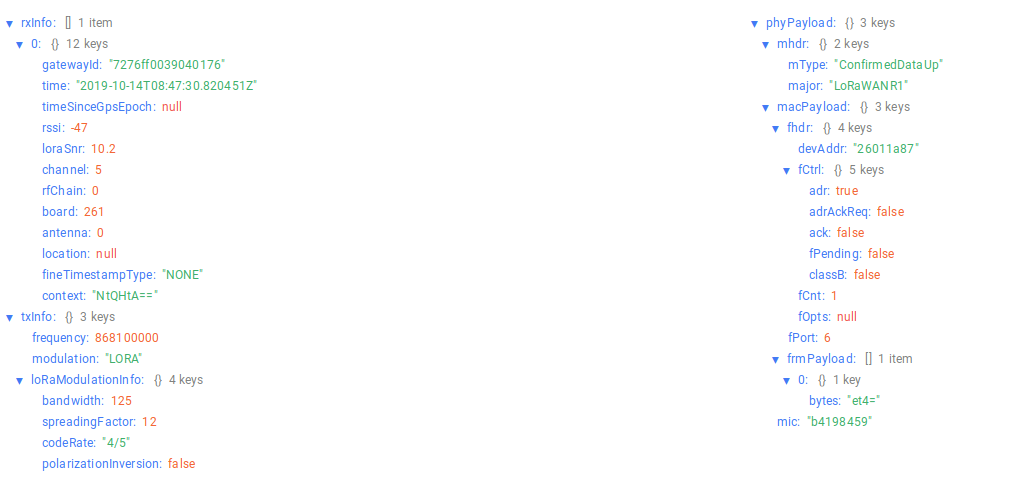
In the first case, the first downlink (downlink1) sets dataRate 5 and txPower 5 and then the successive uplink packet (uplink2) shows spreading factor 7.
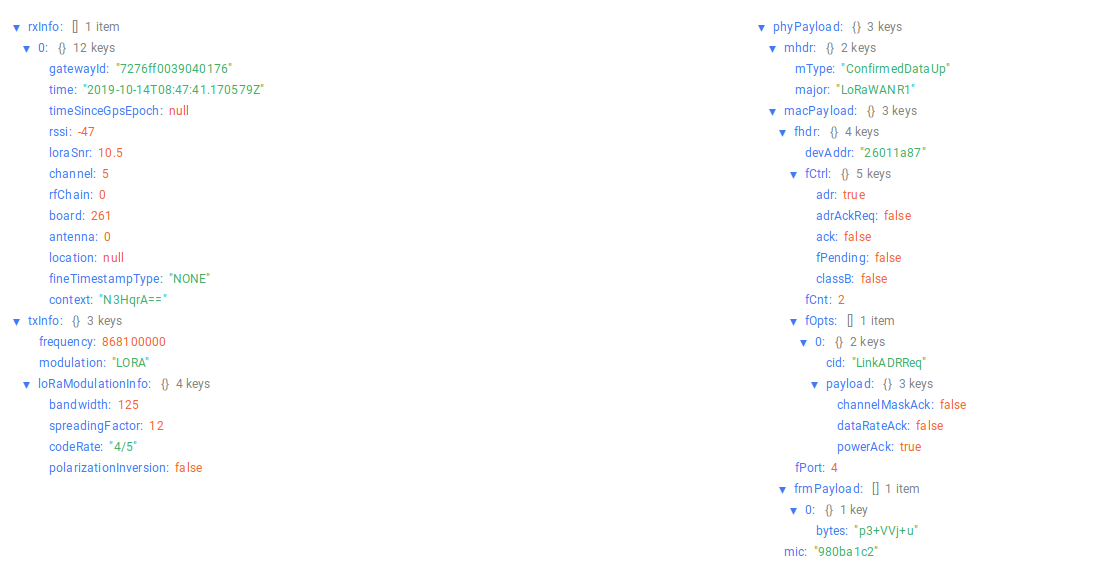
In the secondcase, the first downlink (downlink1) sets dataRate 6 and txPower 0 and then the successive uplink packet (uplink2) shows spreading factor 12 as uplink1 and it remains 12 in the successive uplinks.
Most likely your node does not support DR6 or does not know what 500 KHz channel your gateway supports, so it refuses the setting and stays at DR0.
You’ll probably need to either exclude DR6 from the range of ADR possibilities (not sure exactly how you do that) or configure things so that it actually works.
Yes thank you, you were right. LoRaServer sent the MAC command to switch to DR6 and my device refused it since the 3 default enabled channels (868.1 868.3 868.5 MHz) are set with maximum allowed data rate DR5. I read the confirm of that on the LoRa Regional Parameters 1.0.2rB:
I tried to allow also DR6 for the 3 channels: my device accept the DR change but then my gateway does not receive packets from the device anymore .
Is there a LoRaAppServer configuration that sets DR5 as maximum data rate for ADR ?
Maybe @brocaar knows it.
In my case it seems the server just send a dr 0 right after join. This device is 3 meter away from the server and sends data without problem in dr 5. I have currently only 1 device active on this test server (out of 50 inactive devices). What could be the reason for this behavior from the server? Thanks!
I simply changed the max allowed datarate from 0 to 5 and it works. I’m seeing various dr now coming thru ranging from 0 to 5. Thanks again for the tip!


 It might be helpful to others.