Hi
Does anyone has an idea, why the 1st decoded Data sent to my INfluxdb can simply display in the Influxdb and therefor in grafana, too, but not the 2nd data from my new dragino lht65n sensor? The Bat status is showing up in influx, but the other giving only an error message…


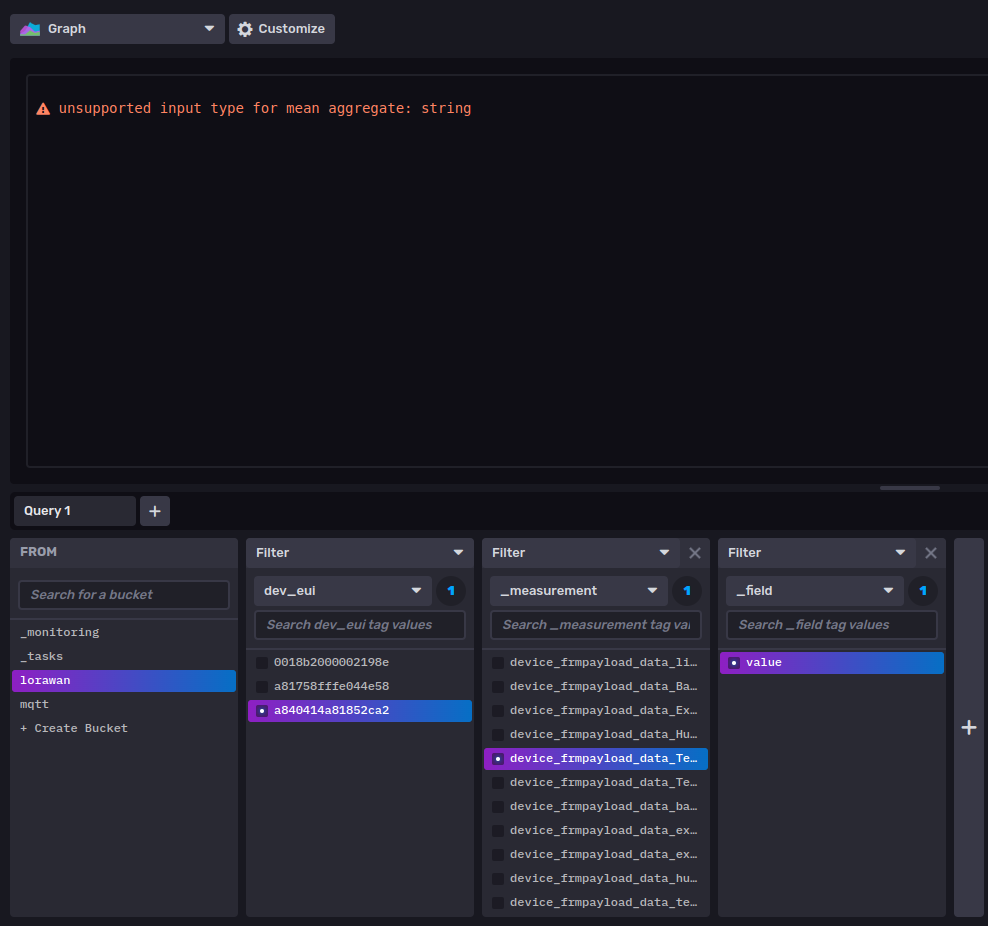
What about the message “Temperatur Sensor”?? Should that the be the problem???
https://gist.github.com/mattrude/e733b35e19b06a9ddd9a580a931b2a2d