Hi,
Pretty new to this so apologies up front if I have missed something in the existing topics. We have set up a Chirpstack server with a number of Rakwireless devices connected via a gateway although we can see the messages coming in within the Gateway LORAWAN Frames window and we also see the connection request frames coming into the Devices LORAWAN Frames window. The problem is that there is no payload message being seen within the Devices nor do we see the “Last seen at” update to active. Any suggestions were to look?
Just wanted to add I have ran though the troubleshooting guide (Connecting a device - ChirpStack open-source LoRaWAN<sup>®</sup> Network Server) and get to this point
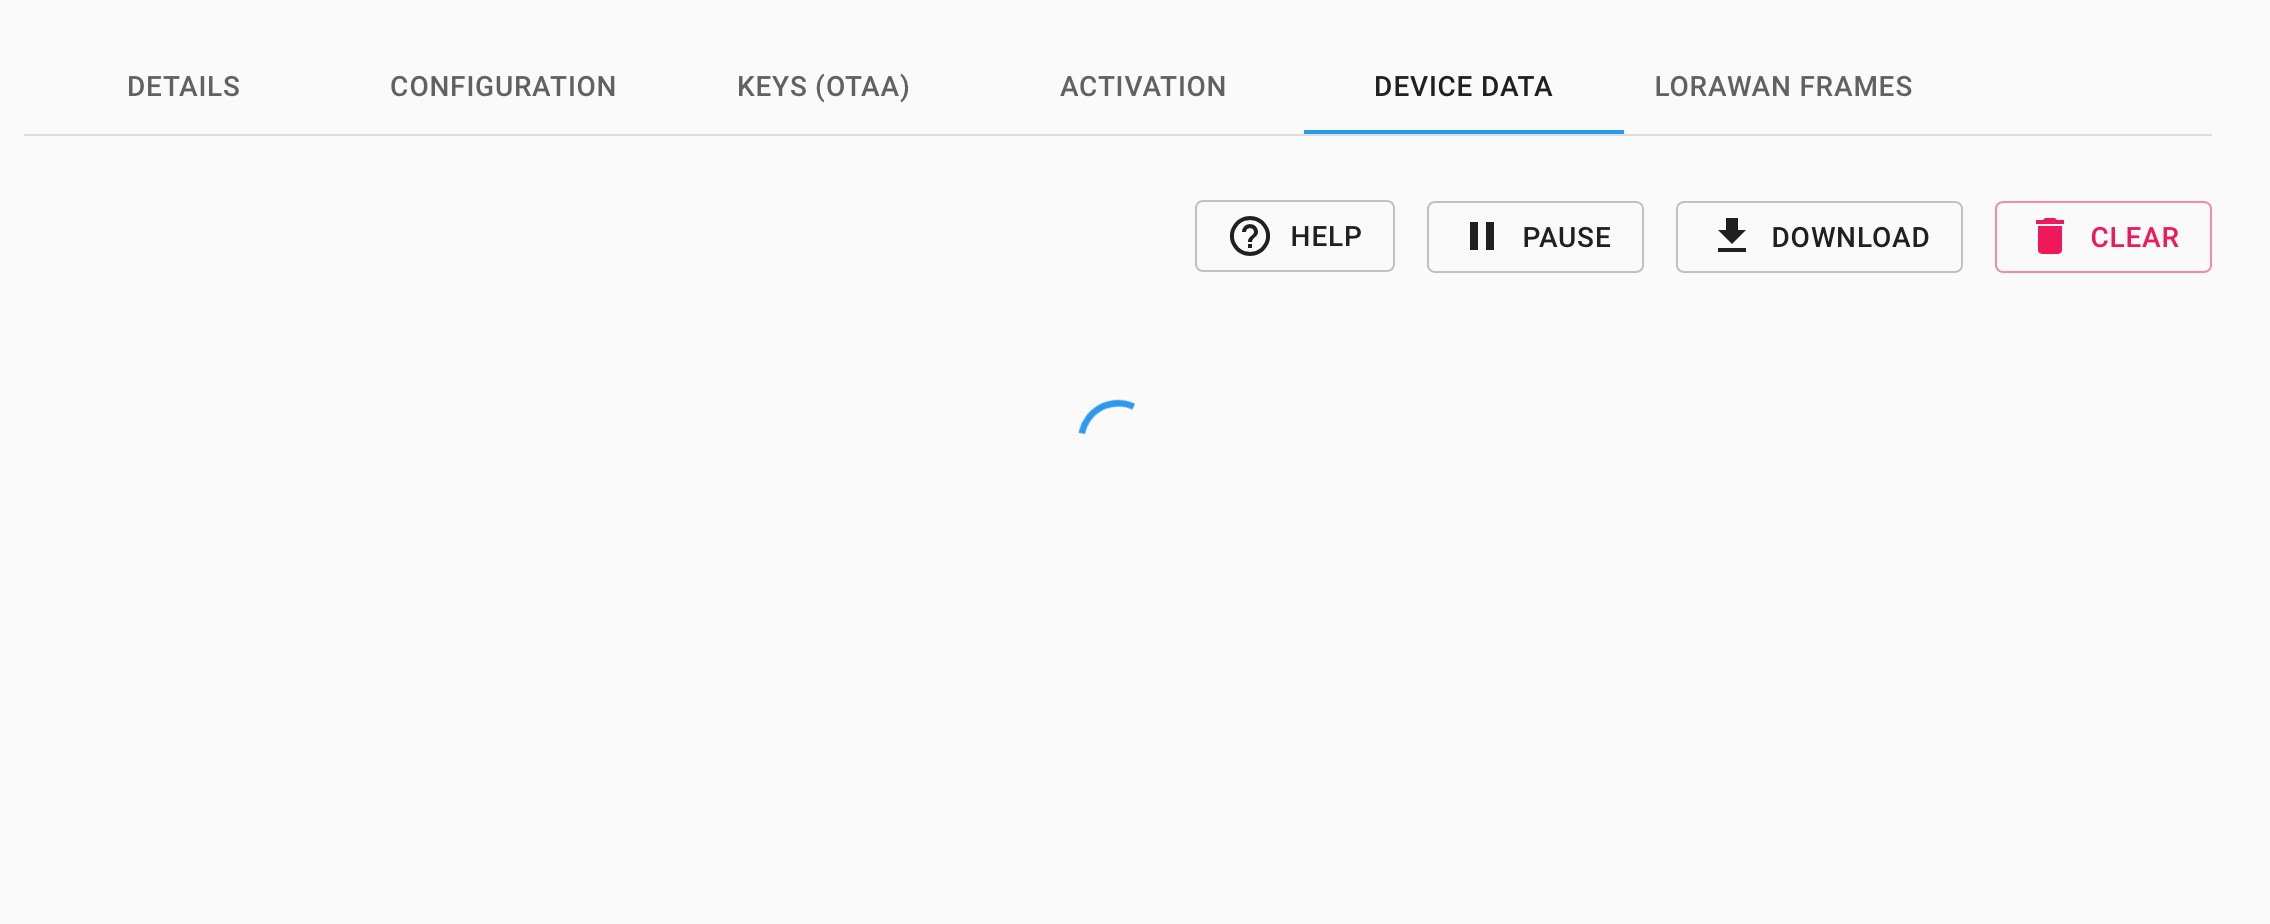
Device data
In case of a failed OTAA activation or if uplink frames are seen under the gateway LoRaWAN frames but not under the device LoRaWAN frames, it is very likely that there is a misconfiguration. In such case, you will find the error message under the Device data tab.
The problem is that the Device Data Tab just seems to hang with the spinning disc on the screen so I cannot see any error message.