We are designing a deployment of an off-grid setup with a gateway as a packet forwarder with an LTE backhaul enabled.
We want to ensure that the setup will be able to support sending an uplink back to NS server (probably hosted in Azure) and Chirpstack will forward to our own APIs the data. Based on those data our API will produce or not a downlink for this device.
We are afraid that on these circumstances the above total round trip time will be above the defaults of the device Rx windows. (assumption: this is the only part that must concern us).
Which are the settings we have to configure and where to ensure success of this integration?
Is this setting on:
–>Device side?
→ Gateway side?
–>or on NS side?
We are using for this PoC.
–>Rak Gateway RAK7268CV2 (Packet Forwader)
–>Device Oyster3 digital matter ABP 1.0
–>chirpstack v4 dockerized in RPI 2 (pending azure deployment)
I’ve been involved in a bunch of deployments with cellular (4G, LTE, LTE-M) backhaul, and despite being wary, none of them required changes to the RX windows. It’s impossible to guess as to what kind of signal quality you’ll get, as it will vary greatly by location and cellular provider. You will need to test it out and see what results you get as part of your PoC.
Thank you for sharing your experience. Since the network latency is not the only factor on our case but also the timings on our server side calculations (web api integration, db etc) in order to produce a downlink based on the previously received uplink it seems impossible that one second is enough. Our scenario could include the following case:
1)Device sends the uplink with certain measurments included (gps, speed, etc)
2) Gateway forwards to the Chirpstack AS
3) HTTP integration to our own web API
4)Evaluation of the received data and decisions made (Geofence limits violations, speed limits exceed etc)
5)Create dedicated downlink based on the above in order to change device settings (switch it to alarm mode etc)
6) queue the downlink to the packet forwarder
7)send the packet
I understand that the above if implemented correctly does not seem that time consuming correct HW sizing considered but we need to experiment on different rainy scenarios in order to be in the safe side.
The devices are of type A and we need to keep the uplinks frequency next to zero for battery efficiency and long life.
The rainy scenarios will be tested prior to the PoC since we are talking for an off-grid remote location so no flexibility for experiments.
I already tried to change 3 things but with no success.
1)Rx delay 5s of the device profile.–> it was showing on the gateway’s messages as described on other posts here in the forum but not respected on the posting of the actual downlink (always the default of 1 s)
2)Rx delay 12s on the NS config.–> it was showing on the gateway’s messages as described on other posts here in the forum but not respected on the posting of the actual downlink (always the default of 1 s)
3) Rx delay 10s on Oyster3 device settings.–> never shown or confirmed on actual downlinks
For points 1, 2 what is the log I should look for to validate that the change was applied and the downlinks waits 5s before they released when an uplink is received?
This approach has been discussed a few times on the forum before, and I believe I remember it not working because a downlink has to be queued at the time that the uplink is received. I could be misremembering, though. I’m sure you can find those threads, if you haven’t already.
Perhaps you next-to-zero uplinks could be set up as two uplinks a few seconds (or minutes) apart that would allow you to queue the downlink you need with plenty of time. Glad to see you’re doing your testing before hitting the field, though.
Rx delay has to be set in NS config. But before it gets active for certain device, that device first has to ack the mac command with this change (assuming the NS value is different from device default). Device default values is what you set in device profile so the NS knows how to comunicate with it at the beginning.
Validating the change is probably easiest in AS frame logs / device data. There should be current value on each packet.
That is not strange, that is correct. Check the contents of downlinks in Lorawan Frames of that device to see what exactly is NS trying to send to device. There should be “delay” mentioned somewhere (I really don’t remember exact command right now).
NS then expects the device to ack that setting in next uplink. If device does not ack that (this may be your problem), NS tries to send it again.
In this case the NS finds that device profile setting is in sync with its network config by default so it does not try to send anything.
The bugreport you posted is regarding v0.22 which is quite ancient, I would not consider it relevant anymore.
Device profile settings should be the same as what device supports by default. That way the NS can check for differences from its network config and adjust the device settings accordingly (using mac-commands in those downlinks you see).
Thank you so much @martin that clarified to me a lot. Just to conclude since i use the gateway as a UDP forwarder where is the downlink queue and where is the delay timer starts ticking. Assuming i have 3s Rx Delay where is this timer starts ticking. Is on the AS side or the gateway (packet forwarder)?
Event published when a downlink frame has been acknowledged by the gateway for transmission.
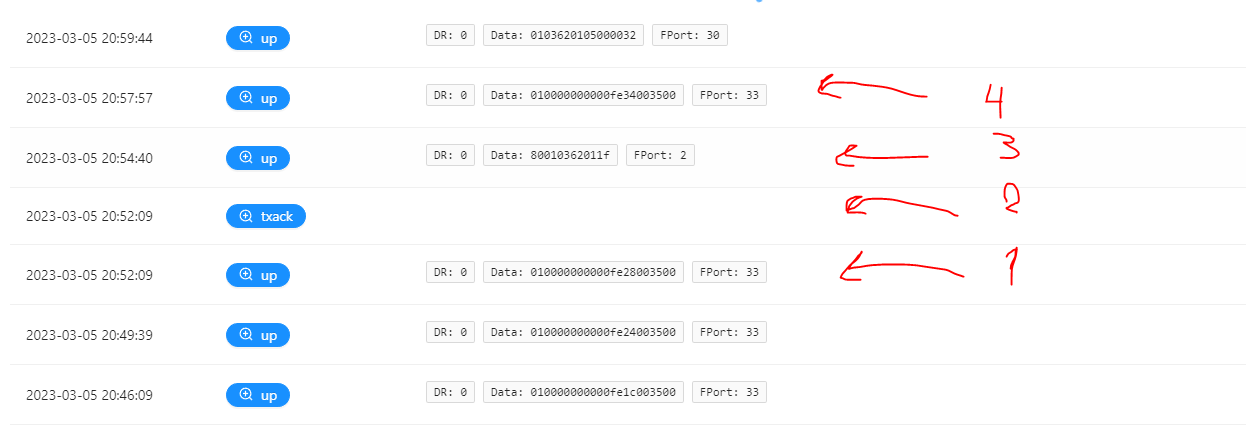
3)normal uplink port 2 (device oriented for acknowledgment of downlinks and validation of correctiveness format wise)
4)normal uplink
on step 2 i did not measure any delay (same second).
To be fair I have no idea. I just know that time of downlink is referenced to GW uplink reception time, so the GW time does not have to be synced with server.
If you want to measure the delay, best place to do it is on device itself. I don’t think you can really measure it in UI. But let me get some things straight as I may have mislead you a bit.
First off, look at device LoRaWAN Frames tab, not Device Data (Events). If you click on blue button (+ UnconfirmedDataDown for example) you can see detailed info for that message.
Now, what I was looking for seems not to be present in V4, but was at V3. This is the info i was looking for as part of Downlink Message:
This does not seem to be in V4 anymore (possible feature request?), but as a workaround you could use the part of Downlink message TX Info:
This means that downlink message was queued with 5s delay instead of default 1s which should only happen if the device acked your NS delay timing. In my case this is part of second downlink.
This is where you should see your 3s delay. If you see default 1s even after few uplink messages, device most likely did not ack the setting.
Hi I can confirm that in frames i see your last pic. I was not sure that if this is in fact applied. So my first question stands how can I can confirm if the delay starts ticking on the server side or in the gateway side?
Thanks a lot by the way for the clarifications. Is there any log i could fetch on packet forwarder to see the timestamps of the downlinks ?