I am trying to setup RAK10701 field tester on my Chirpstack v4 server, which sends uplink to DataCake through HTTP and then DataCake schedules Downlink back to the node via Chirpstack API.
All works fine on upstream, payload is decoded successfully, it is well received on DataCake side, I can see downlink has been scheduled and sent…
But I am not getting data on the end node.
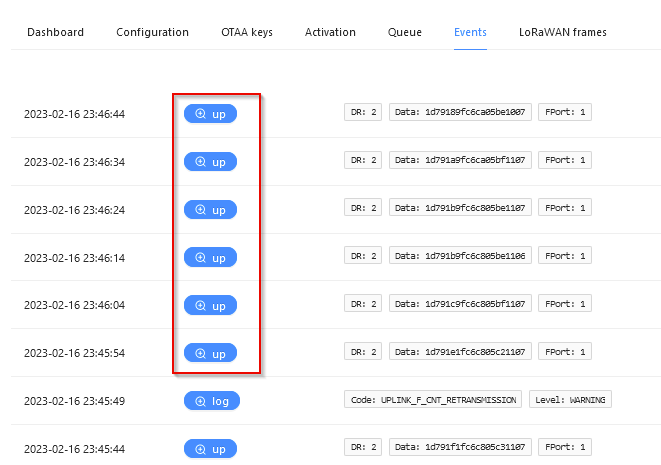
From Chirpstack GUI, Events tab I only see “UP” events. Is this normal or I should have “Down” also?
From the LoRaWAN frames tab, I can see the UncofirmedDataDown immediately after Uplink message, however I noticed the fport is not defined, also these downlink messages are seen even if I disable downlink from DataCake platform.
Question: How I can make sure that downlink is passing the LNS > Gateway >> Node? I need some hints to dig deeper, as I am not familiar with the downlink mechanism.
That makes sense. Thanks for pointing out. Can you direct me where are the steps to install it? I did not notice it here
Edit: I found it here, but once installed, https://[mydomain]/api gives nginx page not found. Should be configuration related. Is there any documentation on it? /etc/chirpstack-rest-api/environment file is only about setting IP:port
Yes I am using nginx already for https and it is working fine. But for API it did not work out of the box. I will create another VPS and experiment there
well, not yet actually. Btw Datacake support responded recently that they have fixed v4 compatibility, but I suspect it works only over https (maybe CORS related?..). And I cannot get Chirpstack API work when I use HTTPs > Separate topic here
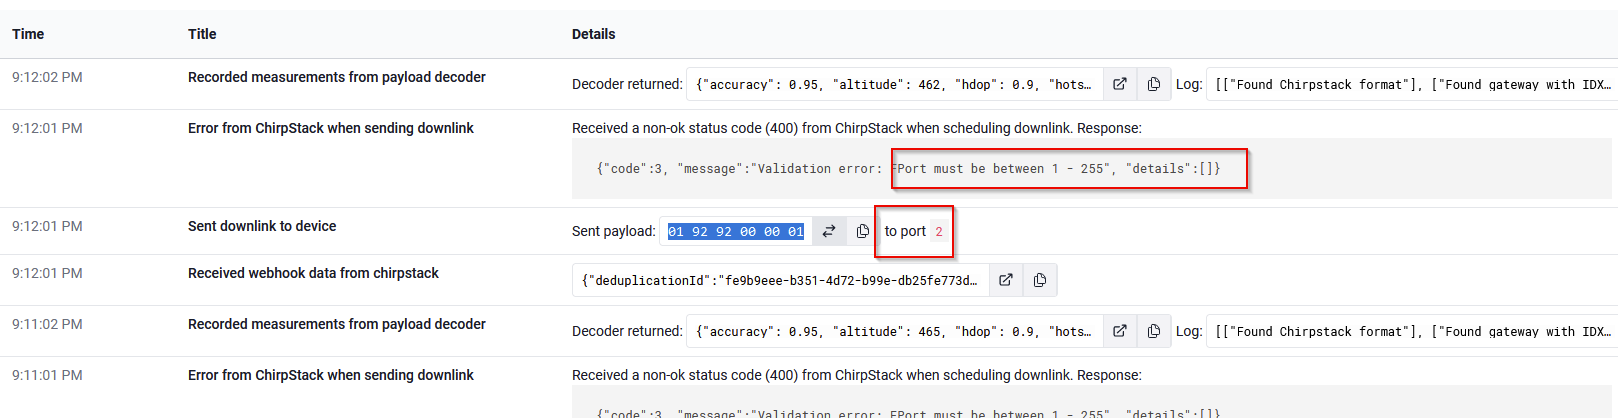
but chirpstack responds with a 400 error and this error message:
{"code":3, "message":"Validation error: FPort must be between 1 - 255", "details":[]}
I assume that details :[] is the data it thinks it is getting for fport which datacake has set to 10. I notice in the error it mentions FPort instead of fport - i’m wondering if case matters?
Also, in chirpstack logs I see status 200, unlike DataCake which tells that Chirpstack responded with 400
May 14 17:55:00  chirpstack[38585]: 2023-05-14T17:55:00.970192Z  INFO chirpstack::integration::http: Posting event event=up url=https://api.datacake.co/integrations/lorawan/chirpstack/
May 14 17:55:00  chirpstack[38585]: 2023-05-14T17:55:00.971763Z  INFO chirpstack::integration::mqtt: Publishing event topic=application/bd6d3d7f-c699-4ef9-8603-481aa9412675/device/ac1f09fffe08e82c/event/up
May 14 17:55:01  chirpstack[38585]: 2023-05-14T17:55:01.072377Z  INFO up{deduplication_id=2e59b3ae-83d7-4d2f-b591-d960418472f2}:data_up: chirpstack::storage::downlink_frame: Downlink-frame saved downlink_id=1402343297
May 14 17:55:01  chirpstack[38585]: 2023-05-14T17:55:01.073174Z  INFO up{deduplication_id=2e59b3ae-83d7-4d2f-b591-d960418472f2}:data_up: chirpstack::storage::device_session: Device-session saved dev_eui=ac1f09fffe08e82c dev_addr=01aa24aa
May 14 17:55:01  chirpstack[38585]: 2023-05-14T17:55:01.073266Z  INFO up{deduplication_id=2e59b3ae-83d7-4d2f-b591-d960418472f2}:data_up: chirpstack::gateway::backend::mqtt: Sending downlink frame gateway_id=169bf3fffea9e42d topic=eu868/gateway/169bf3fffea9e42d/command/down json=true
May 14 17:55:01  chirpstack[38585]: 2023-05-14T17:55:01.148845Z  INFO chirpstack::gateway::backend::mqtt: Message received from gateway region_config_id="eu868" topic="eu868/gateway/169bf3fffea9e42d/event/ack" qos=0 json=true
May 14 17:55:01  chirpstack[38585]: 2023-05-14T17:55:01.150006Z  INFO chirpstack::storage::device_session: Device-session saved dev_eui=ac1f09fffe08e82c dev_addr=01aa24aa
May 14 17:55:01  chirpstack[38585]: 2023-05-14T17:55:01.150081Z  INFO chirpstack::downlink::tx_ack: Log downlink-frame for gateway gateway_id=169bf3fffea9e42d
May 14 17:55:01  chirpstack[38585]: 2023-05-14T17:55:01.150821Z  INFO chirpstack::downlink::tx_ack: Log downlink-frame for device device_eui=ac1f09fffe08e82c
May 14 17:55:01  chirpstack[38585]: 2023-05-14T17:55:01.774252Z DEBUG gRPC{uri=/api.DeviceService/Enqueue}: chirpstack::api: Started processing request
May 14 17:55:01  chirpstack[38585]: 2023-05-14T17:55:01.777160Z  INFO gRPC{uri=/api.DeviceService/Enqueue}: chirpstack::api: Finished processing request status="200" latency=2.918379ms
I will be taking this topic to Datacake support as well.
For clarification, initially I opened this topic as I was not getting any response from Chirpstack server at all. This was fixed after correcting the nginx API proxy pass parameters > thanks to datnus
You can find it on your chirpstack server. Execute below command:
sudo journalctl -f -n 100 -u chirpstack
I also changed the log level to debug for the troubleshooting purposes for now, but I guess the logs you are looking for, should be available in Info mode as well
Thank You! I think I may have found the issue with the datacake command. When you send a item for the queue from datacake, they send something that looks like this:
Sending this via curl returns a 200 and the command ends up in the correct queue for the device.
I will open a ticket with datacake to see if they can get it resolved.
I just got an update from Datacake and this issue appears to be fixed. They have now added an option in the downlink setup to pick either v3 or V4. Note that if you pick V4, it will use the new GPRC API instead of the legacy REST API from v3. I made the mistake of pointing the downlink to the REST API initially which did not work. With it pointed to GPRC, I now get downlinks in the queue.