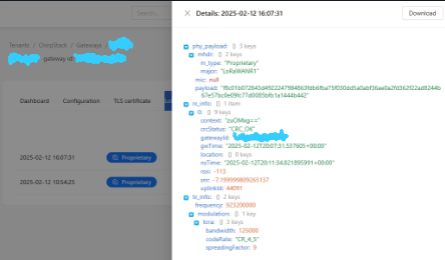
Hi everyone,
I’m having trouble connecting my Dragino LPS8v2 gateway to my ChirpStack server hosted on AWS. The gateway consistently shows as “never seen.” I’ve already verified the region prefixes, tried bridging on both the gateway and server sides, and opened the necessary UDP port 1700. Interestingly, this same Dragino gateway connects and functions perfectly with a different ChirpStack server. I’m at a loss for what to try next. I’ve consulted the Dragino and ChirpStack documentation, but the suggested solutions haven’t resolved the issue.
Likely a firewall issue with your AWS instance. Can you telnet to port 1700 on your AWS instance from another external device? Are there any errors in the Chirpstack logs?
I found the problem thank you, the security policies on the AWS E2C instance were applied to allow traffic but with the TCP protocol and it was UDP, once this was changed it worked perfectly.
We now have a new problem, the registered gateway appears as active and says it is connected, however, it shows up in the EU868 region and the server in AWS is not receiving any LoRa Frames but appears like connected.
However, my entire system is working with the AS923 region and the local server that is working to AS923 that we have for testing tells me that the gateway is disconnected, when yesterday it was active.
What could be the problem? I checked the gateway configuration and there is no problem in that part.
That’d be your MQTT topic prefix. Did you do the docker or Ubuntu install?
You must change the topic prefix to start with as923. The configuration is in your chirpstack-gateway-bridge.toml. If you installed with docker you will have to change them in your docker compose.
Ok, I’m going to check the region prefixes in the ChirpStack server on AWS to see what the configuration is. However, that still doesn’t solve my problem because on my local server I just checked the docker compose and the correct region appears.
but my gateway appears disconnected.
The configuration of both the local server and the gateway was checked and they have the correct configuration.
From your docker compose it doesn’t look like there is a port assigned to the Gateway bridge, but maybe that is just an image edit or you are using basicstation?
Have you made any configuration changes since it was last seen yesterday? Did you just try to point it at your AWS instance and then point it back at the local instance and now it’s not working anymore?
The last seen status is based on the stats messages the gateway sends. How often is the gateway configured to send these?
If none of those narrow it down. Check for MQTT traffic from the gateway by using mosquitto_sub to connect to your MQTT broker, then check the Chirpstack logs for errors.
Lastly does the gateway have any logging of it’s own? Does it say it is transmitting stats messages?
Thank you for your response.
This is the complete gateway bridge configuration it is set to port 1700 and sends stat messages every 30 seconds
No, I didn’t make any additional configurations, just because at that time I managed to make it work and the gateway was connected in both servers. Today, when I logged into the server again, it was disconnected.
Sorry, I don’t understand the last question. Are you referring to the LoRaWAN frames on the server or to the logs on the gateway? In both cases, I’m providing the information that appears.

Log: LoRaWAN (Gateway)
Feb 13 13:44:16 dragino-27eaea fwd[3879]: [INFO~][NETWORK][secondary_server-UP] PUSH_ACK received in 160 ms
Feb 13 13:44:16 dragino-27eaea fwd[3879]: [INFO~][NETWORK][secondary_server-DOWN] PULL_ACK received in 168 ms
Feb 13 13:44:16 dragino-27eaea fwd[3879]: [INFO~][THREAD][fwd-UP] Ended!
…
Feb 13 13:44:16 dragino-27eaea fwd[3879]: lgw_stop:1202: — IN
Feb 13 13:44:16 dragino-27eaea fwd[3879]: lgw_stop:1211: INFO: aborting TX on chain 0
…
Feb 13 13:44:16 dragino-27eaea fwd[3879]: INFO: Disconnecting
Feb 13 13:44:16 dragino-27eaea fwd[3879]: Closing SPI communication interface
Feb 13 13:44:16 dragino-27eaea fwd[3879]: INFO: Closing I2C for temperature sensor
Feb 13 13:44:16 dragino-27eaea fwd[3879]: ERROR: failed to close I2C temperature sensor device (err=-1)
Feb 13 13:44:16 dragino-27eaea fwd[3879]: lgw_stop:1252: — OUT
Feb 13 13:44:16 dragino-27eaea fwd[3879]: [WARNING~][FWD] failed to stop concentrator successfully
Feb 13 13:44:16 dragino-27eaea fwd[3879]: [INFO~]Exiting packet forwarder program
Feb 13 13:44:16 dragino-27eaea systemd[1]: draginofwd.service: Deactivated successfully.
Feb 13 13:44:16 dragino-27eaea systemd[1]: Stopped dragino packet forwarder.
Feb 13 13:44:16 dragino-27eaea systemd[1]: draginofwd.service: Consumed 20min 36.301s CPU time.
Feb 13 17:43:00 dragino-27eaea fwd[1410]: [PKTS~][secondary_server-UP] {“stat”:{“time”:“2025-02-13 17:42:39 GMT”,“rxnb”:0,“rxok”:0,“rxfw”:0,“ackr”:100.0,“dwnb”:0,“txnb”:0,“pfrm”:“SX1302”,“mail”:“”,“desc”:“Dragino LoRaWAN Gateway”}}
Feb 13 17:43:00 dragino-27eaea fwd[1410]: [INFO~][NETWORK][secondary_server-UP] PUSH_ACK received in 146 ms
Feb 13 17:43:00 dragino-27eaea fwd[1410]: [INFO~][NETWORK][secondary_server-DOWN] PULL_ACK received in 150 ms
Feb 13 17:43:00 dragino-27eaea fwd[1410]: [INFO~][NETWORK][secondary_server-DOWN] PULL_ACK received in 153 ms
Feb 13 17:43:00 dragino-27eaea fwd[1410]: [INFO~][NETWORK][secondary_server-DOWN] PULL_ACK received in 157 ms
Feb 13 17:43:00 dragino-27eaea fwd[1410]: [INFO~][NETWORK][secondary_server-DOWN] PULL_ACK received in 170 ms
Feb 13 17:45:07 dragino-27eaea fwd[1410]: [INFO~][NETWORK][secondary_server-DOWN] PULL_ACK received in 160 ms
Feb 13 17:45:07 dragino-27eaea fwd[1410]: [INFO~][NETWORK][secondary_server-DOWN] PULL_ACK received in 168 ms
I have the impression, after investigating a little further, that a restart occurred and the gateway is now working differently. The odd thing is that the configuration hasn’t changed from yesterday to today, so it’s not that it reverted to factory settings.
I assume the “secondary_server” in these logs is the AWS instance?
Looks like the gateway is not sending any messages what so ever to your primary server. So this seems to be a gateway issue rather than a server issue.
The only thing I can think of is to reboot the gateway and then monitor the logs for any errors that might indicate why it is not sending to your primary server.


