Gateway is visible in Chirpstack with “Last seen” date set.
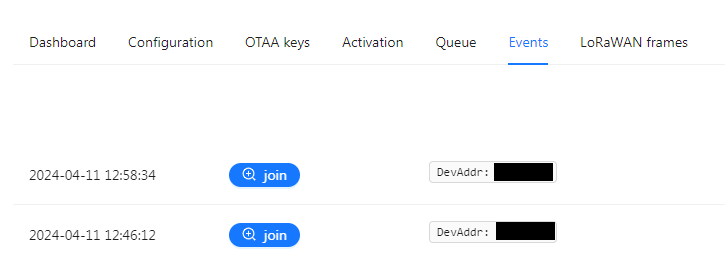
Nodes added to my app created in Chirpstack are active (OTAA) but their “Last seen” date is set to “never”.
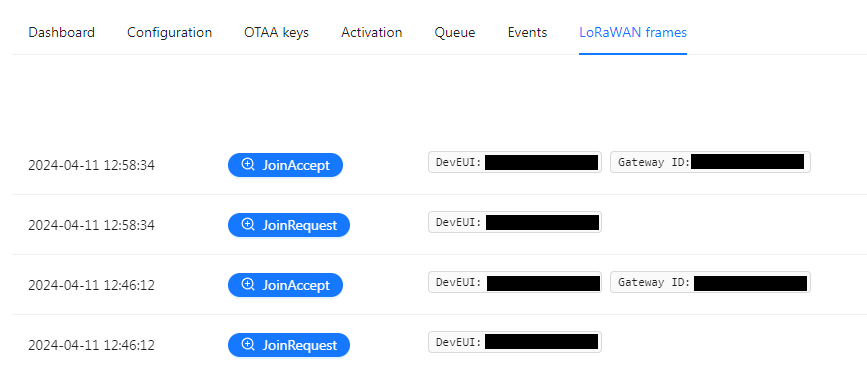
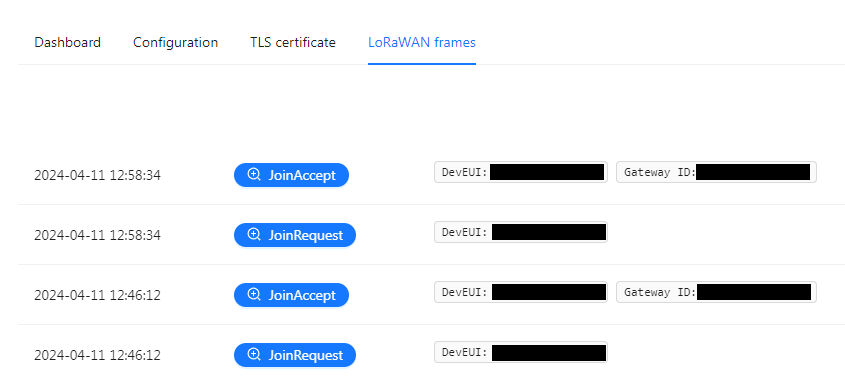
There are join events in “LoRaWAN frames” tab for both gateway and nodes (JoinRequest and JoinAccept), but nothing more.
My question is if this is expected behaviour for node without any sensor connected? I assumed that node “Last seen” date would change in the same way as for gateway, event without any sensor.
Of course I don’t expect any additional payload in logs before I connect the sensors. I’m expecting their delivery soon.
I also checked logs and no errors found there.
Any suggestions? I can provide more details if needed. This is totally new for me
Devices remain “never seen” until their first uplink, I’m not sure how that specific Dragino device works but if it isn’t sending any uplinks yet (because you claim sensor isn’t attached?) then this is all expected behaviour and nothing to worry about.
If the device is sending uplinks but Chirpstack is not receiving them after the join accept, this is typically an issue when Chirpstack tells the device to use the wrong sub-band in the join response, this can happen when:
The device profile is configured wrong
Your region isn’t enabled in the Chirpstack.toml
Your Gateway Bridge / MQTT Forwarder is sending the wrong topic-prefixes
I finally got the sensor (pulse/contact) and tried connecting it without any changes. To be clear by changes I mean seeing the payload in Chirpstack.
So I got the USB-TTL RS232 cable then to look inside the node.
Here’s AT+CFG result:
[16:56:08.114] AT+CFG
[16:56:08.188]
[16:56:08.195] Stop Tx events,Please wait for all configurations to print
[16:56:08.253]
[16:56:08.255] AT+DEUI=xx xx xx xx xx xx xx xx
[16:56:08.255] AT+APPEUI=xx xx xx xx xx xx xx xx
[16:56:08.325] AT+APPKEY=xx xx xx xx xx xx xx xx xx xx xx xx xx xx xx xx
[16:56:08.385] AT+DADDR=xx xx xx xx
[16:56:08.385] AT+NWKSKEY=xx xx xx xx xx xx xx xx xx xx xx xx xx xx xx xx
[16:56:08.455] AT+APPSKEY=xx xx xx xx xx xx xx xx xx xx xx xx xx xx xx xx
[16:56:08.505] AT+ADR=1
[16:56:08.505] AT+TXP=0
[16:56:08.545] AT+DR=0
[16:56:08.596] AT+DCS=0
[16:56:08.646] AT+PNM=1
[16:56:08.706] AT+RX2FQ=869525000
[16:56:08.749] AT+RX2DR=0
[16:56:08.802] AT+RX1DL=1000
[16:56:08.851] AT+RX2DL=2000
[16:56:08.901] AT+JN1DL=5000
[16:56:08.951] AT+JN2DL=6000
[16:56:08.995] AT+NJM=1
[16:56:09.058] AT+NWKID=00 00 00 00
[16:56:09.095] AT+FCU=0
[16:56:09.145] AT+FCD=0
[16:56:09.197] AT+CLASS=A
[16:56:09.244] AT+NJS=0
[16:56:09.297] AT+RECVB=0:
[16:56:09.346] AT+RECV=0:
[16:56:09.397] AT+RJTDC=20
[16:56:09.444] AT+RPL=0
[16:56:09.505] AT+VER=v1.8.1 EU868
[16:56:09.547] AT+CFM=0,7,0
[16:56:09.593] AT+CFS=0
[16:56:09.643] AT+SNR=0
[16:56:09.694] AT+RSSI=0
[16:56:09.749] AT+TDC=1200000
[16:56:09.793] AT+PORT=2
[16:56:09.845] AT+RX1WTO=6
[16:56:09.895] AT+RX2WTO=6
[16:56:09.946] AT+DECRYPT=0
[16:56:09.991] AT+MOD=1
[16:56:10.045] AT+INTMOD1=2
[16:56:10.095] AT+INTMOD2=2
[16:56:10.145] AT+INTMOD3=2
[16:56:10.198] AT+WEIGAP=400.0
[16:56:10.243] AT+5VT=500
[16:56:10.290] AT+CHS=0
[16:56:10.355] AT+DDETECT=1,1440,2880
[16:56:10.403] AT+SETMAXNBTRANS=1,0
[16:56:10.450] AT+DISFCNTCHECK=0
[16:56:10.497] AT+DISMACANS=0
[16:56:11.056]
[16:56:11.065] Start Tx events
[16:56:11.065]
[16:56:11.065] OK
Then I checked the forum and found a thread about accept join request loop. So I checked the node events after power on and this is how it looks like:
[16:31:33.003] LSN50 Device
[16:31:33.003] Image Version: v1.8.1
[16:31:33.003] LoRaWan Stack: DR-LWS-007
[16:31:33.073] Frequency Band: EU868
[16:31:33.073] DevEui= XX XX XX XX XX XX XX XX
[16:31:33.073]
[16:31:33.128] Please use AT+DEBUG to see debug info
[16:31:33.133]
[16:31:33.133] ***** UpLinkCounter= 0 *****
[16:31:33.183] TX on freq 868.500 MHz at DR 5
[16:31:33.183] txDone
[16:31:38.124] RX on freq 868.500 MHz at DR 5
[16:31:38.132] rxTimeOut
[16:31:39.153] RX on freq 869.525 MHz at DR 0
[16:31:39.331] rxTimeOut
[16:31:40.062]
[16:31:40.126] ***** UpLinkCounter= 0 *****
[16:31:40.133] TX on freq 868.100 MHz at DR 5
[16:31:40.137] txDone
[16:31:45.161] RX on freq 868.100 MHz at DR 5
[16:31:45.163] rxTimeOut
[16:31:46.190] RX on freq 869.525 MHz at DR 0
[16:31:46.366] rxTimeOut
[16:31:47.099]
[16:31:47.163] ***** UpLinkCounter= 0 *****
[16:31:47.173] TX on freq 868.100 MHz at DR 5
[16:31:47.174] txDone
[16:31:52.198] RX on freq 868.100 MHz at DR 5
[16:31:52.203] rxTimeOut
[16:31:53.228] RX on freq 869.525 MHz at DR 0
[16:31:53.404] rxTimeOut
[16:31:54.137]
[16:31:54.200] ***** UpLinkCounter= 0 *****
[16:31:54.203] TX on freq 868.300 MHz at DR 4
[16:31:54.261] txDone
[16:31:59.290] RX on freq 868.300 MHz at DR 4
[16:31:59.293] rxTimeOut
[16:32:00.318] RX on freq 869.525 MHz at DR 0
[16:32:00.494] rxTimeOut
[16:32:05.641]
[16:32:05.643] ***** UpLinkCounter= 0 *****
[16:32:05.643] TX on freq 868.100 MHz at DR 4
[16:32:05.698] txDone
[16:32:10.727] RX on freq 868.100 MHz at DR 4
[16:32:10.733] rxTimeOut
[16:32:11.754] RX on freq 869.525 MHz at DR 0
[16:32:11.931] rxTimeOut
[16:32:17.078]
[16:32:17.083] ***** UpLinkCounter= 0 *****
[16:32:17.083] TX on freq 868.300 MHz at DR 4
[16:32:17.136] txDone
[16:32:22.164] RX on freq 868.300 MHz at DR 4
[16:32:22.173] rxTimeOut
[16:32:23.192] RX on freq 869.525 MHz at DR 0
[16:32:23.368] rxTimeOut
[16:32:28.510]
[16:32:28.513] ***** UpLinkCounter= 0 *****
[16:32:28.513] TX on freq 868.500 MHz at DR 3
[16:32:28.665] txDone
[16:32:33.687] RX on freq 868.500 MHz at DR 3
[16:32:33.766] rxTimeOut
[16:32:34.722] RX on freq 869.525 MHz at DR 0
[16:32:34.898] rxTimeOut
[16:32:49.152]
[16:32:49.152] ***** UpLinkCounter= 0 *****
[16:32:49.152] TX on freq 868.100 MHz at DR 3
[16:32:49.303] txDone
[16:32:54.324] RX on freq 868.100 MHz at DR 3
[16:32:54.365] rxTimeOut
[16:32:55.359] RX on freq 869.525 MHz at DR 0
[16:32:55.535] rxTimeOut
[16:33:09.789]
[16:33:09.793] ***** UpLinkCounter= 0 *****
[16:33:09.793] TX on freq 868.300 MHz at DR 3
[16:33:09.940] txDone
[16:33:14.961] RX on freq 868.300 MHz at DR 3
[16:33:14.978] rxTimeOut
[16:33:15.996] RX on freq 869.525 MHz at DR 0
[16:33:16.172] rxTimeOut
[16:33:30.422]
[16:33:30.423] ***** UpLinkCounter= 0 *****
[16:33:30.423] TX on freq 868.100 MHz at DR 2
[16:33:30.742] txDone
[16:33:35.770] RX on freq 868.100 MHz at DR 2
[16:33:35.807] rxTimeOut
[16:33:36.797] RX on freq 869.525 MHz at DR 0
[16:33:36.973] rxTimeOut
[16:34:07.558]
[16:34:07.563] ***** UpLinkCounter= 0 *****
[16:34:07.563] TX on freq 868.100 MHz at DR 2
[16:34:07.878] txDone
[16:34:12.906] RX on freq 868.100 MHz at DR 2
[16:34:12.943] rxTimeOut
[16:34:13.933] RX on freq 869.525 MHz at DR 0
[16:34:14.110] rxTimeOut
[16:34:44.700]
[16:34:44.703] ***** UpLinkCounter= 0 *****
[16:34:44.703] TX on freq 868.500 MHz at DR 2
[16:34:45.015] txDone
[16:34:50.043] RX on freq 868.500 MHz at DR 2
[16:34:50.080] rxTimeOut
[16:34:51.070] RX on freq 869.525 MHz at DR 0
[16:34:51.246] rxTimeOut
[16:35:21.769]
[16:35:21.833] ***** UpLinkCounter= 0 *****
[16:35:21.843] TX on freq 868.300 MHz at DR 1
[16:35:22.604] txDone
[16:35:27.645] RX on freq 868.300 MHz at DR 1
[16:35:27.723] rxTimeOut
[16:35:28.660] RX on freq 869.525 MHz at DR 0
[16:35:28.837] rxTimeOut
[16:36:44.271]
[16:36:44.273] ***** UpLinkCounter= 0 *****
[16:36:44.273] TX on freq 868.100 MHz at DR 1
[16:36:45.039] txDone
[16:36:50.080] RX on freq 868.100 MHz at DR 1
[16:36:50.158] rxTimeOut
[16:36:51.095] RX on freq 869.525 MHz at DR 0
[16:36:51.271] rxTimeOut
[16:38:06.702]
[16:38:06.703] ***** UpLinkCounter= 0 *****
[16:38:06.703] TX on freq 868.300 MHz at DR 1
[16:38:07.475] txDone
[16:38:12.515] RX on freq 868.300 MHz at DR 1
[16:38:12.718] rxTimeOut
[16:38:13.530] RX on freq 869.525 MHz at DR 0
[16:38:13.707] rxTimeOut
[16:39:29.140]
[16:39:29.143] ***** UpLinkCounter= 0 *****
[16:39:29.143] TX on freq 868.300 MHz at DR 0
[16:39:30.567] txDone
[16:39:35.624] RX on freq 868.300 MHz at DR 0
[16:39:35.801] rxTimeOut
[16:39:36.624] RX on freq 869.525 MHz at DR 0
[16:39:36.800] rxTimeOut
[16:41:57.471]
[16:41:57.473] ***** UpLinkCounter= 0 *****
[16:41:57.473] TX on freq 868.300 MHz at DR 0
[16:41:58.903] txDone
[16:42:03.958] RX on freq 868.300 MHz at DR 0
[16:42:04.135] rxTimeOut
[16:42:04.958] RX on freq 869.525 MHz at DR 0
[16:42:05.134] rxTimeOut
[16:44:25.810]
[16:44:25.813] ***** UpLinkCounter= 0 *****
[16:44:25.813] TX on freq 868.300 MHz at DR 0
[16:44:27.238] txDone
[16:44:32.294] RX on freq 868.300 MHz at DR 0
[16:44:32.470] rxTimeOut
[16:44:33.293] RX on freq 869.525 MHz at DR 0
[16:44:33.470] rxTimeOut
Then the last part repeats continuously each 150 seconds (approximately) - I mean this one:
[16:44:25.813] ***** UpLinkCounter= 0 *****
[16:44:25.813] TX on freq 868.300 MHz at DR 0
[16:44:27.238] txDone
[16:44:32.294] RX on freq 868.300 MHz at DR 0
[16:44:32.470] rxTimeOut
[16:44:33.293] RX on freq 869.525 MHz at DR 0
[16:44:33.470] rxTimeOut
Does it mean that join request & join accept are visible in Chirpstack’s LoRaWAN frames but node doesn’t receive join accept message back?
I spent last weeks without any progress Happy to share any data you need!
Show me some photos of the below in ChirpStack GUI:
Events and LoRaWAN frame for the gateway and device. I would like to see if Chirpstack receives the join request and sends back join accept.
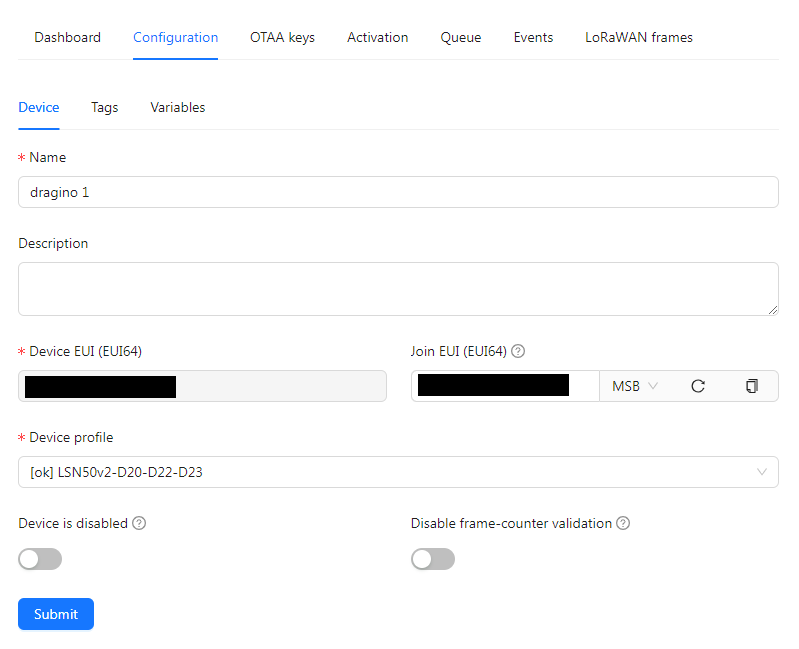
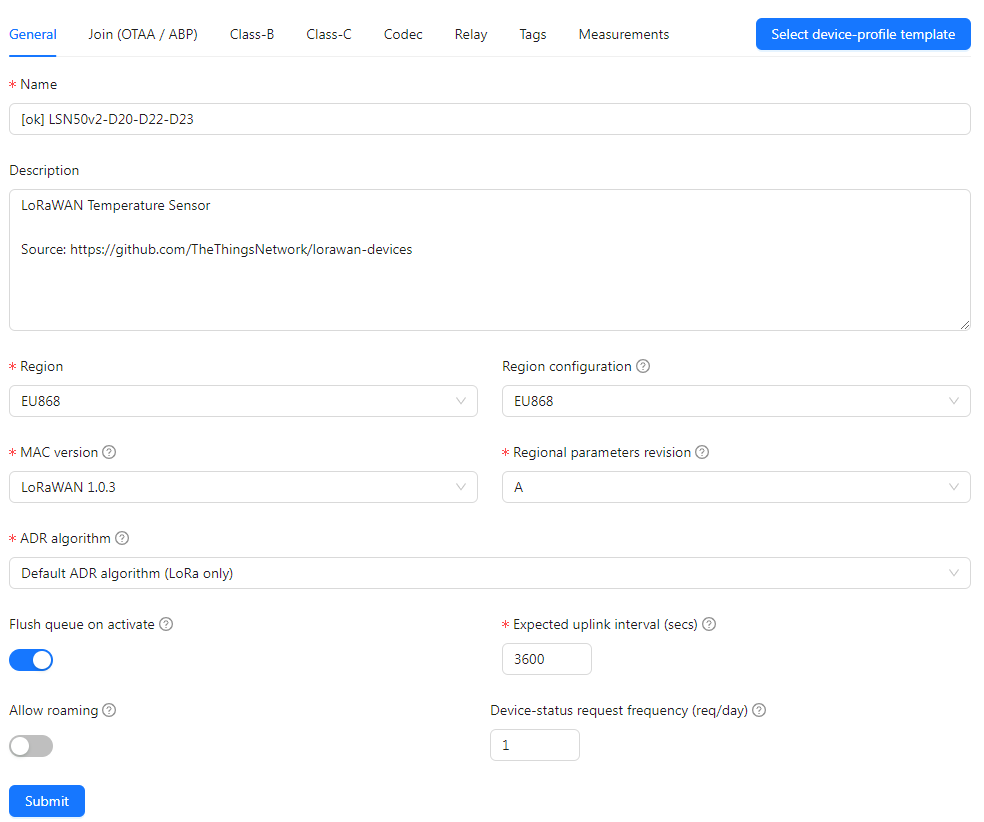
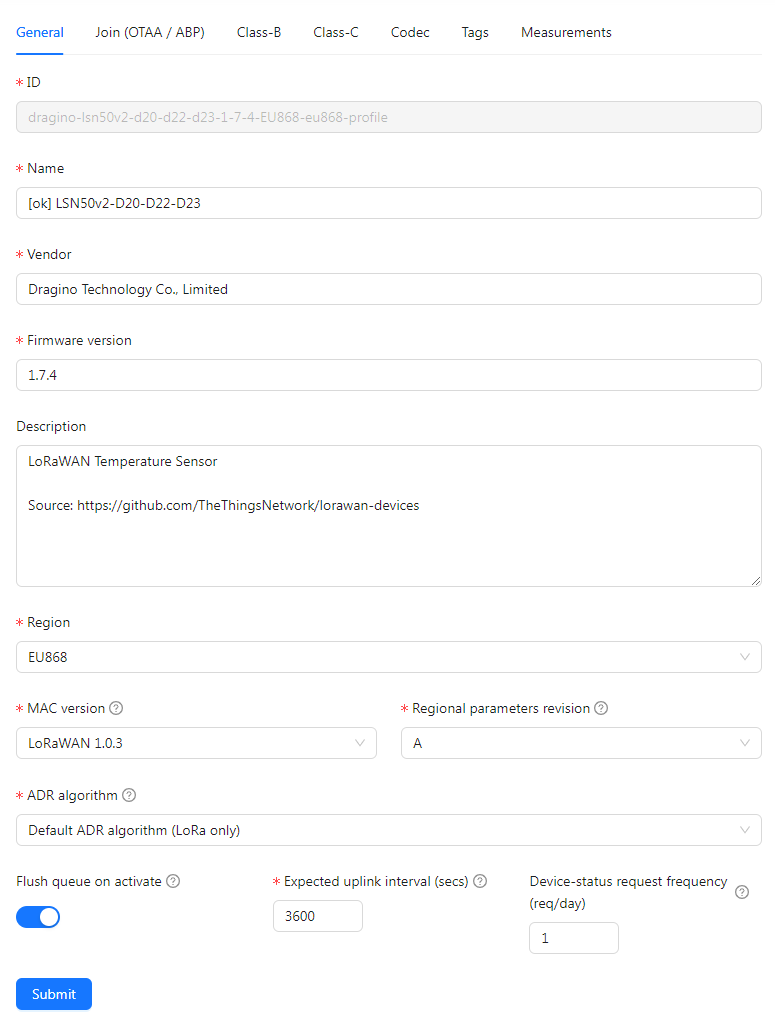
Gateway info, device info and device profile. I would like to see if the gateway is using EU868 in ChirpStack.
Please set AT+TDC=60000 to send every 1 minute for debugging.
The default AT+TDC=1200000 is 1200 seconds (e.g 20 minutes)
Continuos UpLinkCounter= 0 means the node is unable to join the LoRaWAN server yet.
It is trying to join.
Usually, there is mismatch of frequency plan between Chirpstack, gateway and device.
I use LSN50, Dragino LPS8 and Chirpstack v4 and they work fine in my AS923.
Here is the data you asked. If you need raw txt data (like payload) let me know.
Sorry for multiple posts but it seems that as a new user I have limitations (1 embedded image & 2 external urls per post)
Most of the time, the RX1 and Rx2 will be timeout as there is no downlink from server.
After sending join request, the node should receive the Join Accept via one RX1.
[09:28:37.735] ***** UpLinkCounter= 0 *****
[09:28:37.785] TX on freq 868.500 MHz at DR 5
[09:28:37.785] txDone
[09:28:42.726] RX on freq 868.500 MHz at DR 5
[09:28:42.734] rxTimeOut
[09:28:43.755] RX on freq 869.525 MHz at DR 0
[09:28:43.931] rxTimeOut
[09:28:44.662]
[09:28:44.726] ***** UpLinkCounter= 0 *****
[09:28:44.734] TX on freq 868.300 MHz at DR 5
[09:28:44.737] txDone
[09:28:49.762] RX on freq 868.300 MHz at DR 5
[09:28:49.765] rxTimeOut
[09:28:50.791] RX on freq 869.525 MHz at DR 0
[09:28:50.968] rxTimeOut
[09:28:51.701]
[09:28:51.764] ***** UpLinkCounter= 0 *****
[09:28:51.765] TX on freq 868.500 MHz at DR 5
[09:28:51.776] txDone
[09:28:56.788] RX on freq 868.500 MHz at DR 5
[09:28:56.870] rxDone
[09:28:56.874] Rssi= -104
[09:28:56.874] JOINED
[09:28:57.993]
[09:28:57.994] ***** UpLinkCounter= 0 *****
[09:28:57.994] TX on freq 867.100 MHz at DR 0
[09:28:59.421] txDone
[09:29:00.477] RX on freq 867.100 MHz at DR 0
[09:29:00.653] rxTimeOut
[09:29:01.477] RX on freq 869.525 MHz at DR 0
[09:29:01.653] rxTimeOut
[09:29:57.990]
[09:29:57.995] ***** UpLinkCounter= 1 *****
[09:29:57.995] TX on freq 868.100 MHz at DR 0
[09:29:59.418] txDone
[09:30:00.474] RX on freq 868.100 MHz at DR 0
[09:30:00.650] rxTimeOut
[09:30:01.474] RX on freq 869.525 MHz at DR 0
[09:30:01.650] rxTimeOut
[09:30:57.983]
[09:30:57.984] ***** UpLinkCounter= 2 *****
[09:30:57.984] TX on freq 868.500 MHz at DR 0
[09:30:59.416] txDone
[09:31:00.472] RX on freq 868.500 MHz at DR 0
[09:31:00.648] rxTimeOut
[09:31:01.472] RX on freq 869.525 MHz at DR 0
[09:31:01.648] rxTimeOut
[09:31:57.981]
[09:31:57.984] ***** UpLinkCounter= 3 *****
[09:31:57.984] TX on freq 867.900 MHz at DR 0
[09:31:59.415] txDone
[09:32:00.471] RX on freq 867.900 MHz at DR 0
[09:32:00.647] rxTimeOut
[09:32:01.471] RX on freq 869.525 MHz at DR 0
[09:32:01.647] rxTimeOut
...
After so many days I finally saw the magic JOINED
Thank you and the other users in this thread so much for your time and efforts to help some unknown guy! Now I’m finally excited again to learn this piece of tech as I’m going to connect the sensor and read data via Chirpstack’s API.
Days spent with this issue stole my initial enthusiasm. Now I feel it again!
I will reply to this as it may help for anyone in future
I disabled all blocking firewall rules on the gateway to be sure that it won’t interfere communication.
I had some concerns about the distance between devices and gateway because I found some posts here that it may be a problem if they are too far or too close. Distance between my gateway and devices is currently around 12 meters and it works fine. So it was not my problem, at least this time