Hi there!
I just installed LoRaServer and everything was working just ok before I tried to set up influxdb integration. Loraserver is installed on RPi, influx and Grafana are installed on other machine. Integration configuration looks like this:
Ok, that was network issue which is fixed now, but the next issue is with parsing. Error message says “invalid boolean” for every data field from object. Why does it even think, that it should be boolean?
I have minimized my decoding script, to return only one value - uptime, and the script looks like this:
function Decode(fPort, bytes) {
if (fPort == 1 && bytes[0] == 1) {
var node_time = bytes[1] | bytes[2] << 8 | bytes[3] << 16 | bytes[4] << 24;
var node_time_s = node_time / 1000.0;
return {
“uptime [s]” : node_time_s
};
}
else {
return {}
}
}
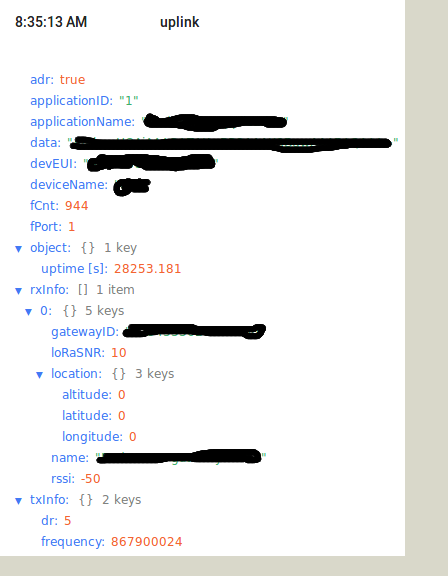
It works just fine, for decoding uptime and showing it in lora-app-server:
But, lora-app-server log still returns this message:
Jul 25 05:35:13 raspberrypi lora-app-server[580]: time=“2019-07-25T05:35:13Z” level=error msg=“integration/multi: integration *influxdb.Integration error” error=“sending measurements error: expected 2xx response, got: 400 ({“error”:“partial write: unable to parse ‘device_frmpayload_data_uptime [s],application_name=my-application,dev_eui=XXXXXXXXXXX,device_name=XXX,f_port=1 value=28253.181000’: invalid boolean dropped=0”}\n)”
Returned value is just like everybody else has returned, but for them it works fine. Is it possible that problem is in influxDB itself or am I missing something?
When InfluxDB sees a measurement for the first time, it will detect the type of the measurement and all future measurements must use the same time. Else it will raise an error that the data you are trying to write is invalid, which is the error you’re seeing I believe.
I appreciate your answer, brocaar! While testing and writing an reply, I found out that the problem was in the variable name. As you see in the photo, the variable is called “uptime [s]” - InfluxDB doesn`t like the brackets. Edited my codec and everything works like a charm. Thanks!