Hi all!
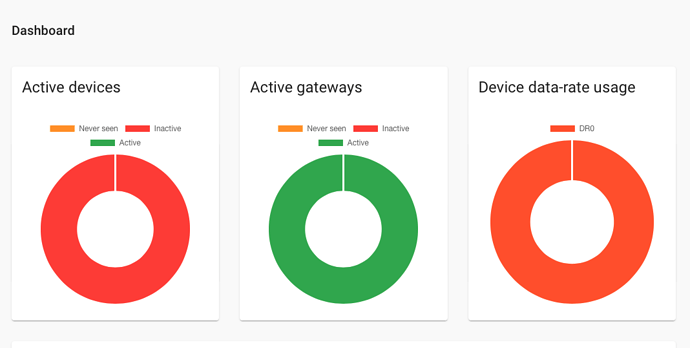
I have configured a gateway (RAK2245) to the Chirpstack Application Server. It appears active in the dashboard as well as in the “Gateways” panel. I have joined the server with a LoRa E5 Dev Board. I receive the LoRaWAN Frames and can see the device data as well when I join and send messages from the board. However, for some reason is not shown as “active” in the Application Server Dashboard. It only shows as “active a few seconds ago” e.g. in the Applications/Devices panel.
Does anyone know why this might be the case that I cannot see it active in the Dashboard? I would really appreciate your input.
Application Server Dashboard (Inactive Device, Active Gateway):
Note: I wanted to post more pictures of the LoRaWAN Frames and Device data which are active and can be seen perfectly fine, but the forum only allowed me to post one single attachment.
Thank you!
