I am using the LoRa server installed using the docker image.
And I am using the App-server API console to trigger Downlink messages(using the POST method of “Device Queue”).
The message is getting queued but I don’t see any further logs from App server corresponding to Downlink. Rather the downlink item in the queue just gets deleted.
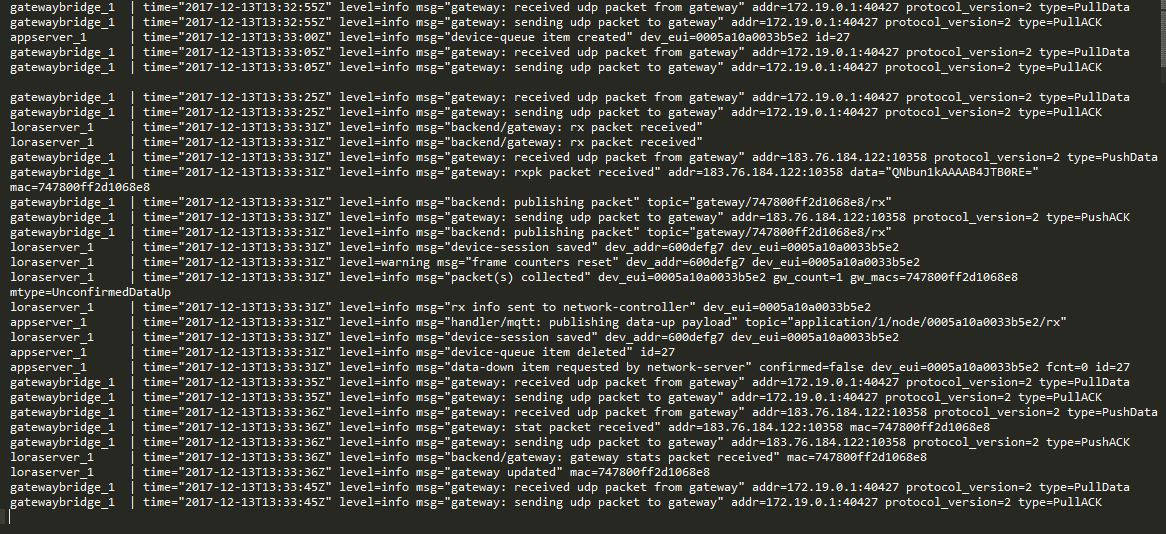
I am using ABP. The logs can be found in the attached picture.
Could you let me know what the issue might be? Is there anything specific to downlink that needs to be configured?
Also, a couple of specific questions related to the configuration:
I am unable to add any entries to “Factory-present frequencies” in my Device-profile. Will that be taken care by default? Or could that be a potential error for downlink?
In the documentation at “https://docs.loraserver.io/install/docker/”, there is a mention that “Please use this docker-compose.yml file as a starting point, not as a ready to use solution.”
Is there anything specific that needs to be taken care of in the docker installation, for downlink to work?
The versions/tags of the docker images are as follows:
Please note that a downlink can only be transmitted after an uplink transmission from your device (in Class-A). Please refer to the LoRaWAN specification (https://www.lora-alliance.org/lorawan-for-developers) for more information about receive windows.
@brocaar Yes, of course! I am sending an uplink transmission and waiting for the en-queued item to be sent downlink. But it’s not happening. I even see the Uplink transmissions in the raw-frame logs
And it’s only after the uplink transmission, the log says " time=“2017-12-13T13:33:31Z” level=info msg=“data-down item requested by network-server” confirmed=false dev_eui=0005a10a0033b5e2 fcnt=0 id=27". This is indicative of the Rx windows, right ??
Yes, this indicates that LoRa Server is pulling an item from the queue. Did you look at the .../tx topic: https://docs.loraserver.io/lora-gateway-bridge/use/data/? You’ll see all data to be transmitted by the gateway on that topic.
Really appreciate all your work here!!
I have the same issue where the post via /api/devices/{devEUI}/queue, on the api test page, does put the message on the device queue, but I don’t see it in the downlink payload after a new uplink came in. The queue is then emptied afterwards.
json: {“data”: “MTM=”, “confirmed”:true, “reference”: “3233”}
I observed this behaviour today as well. I am trying to investigate why the payload was null. Might be the encoder function. Is there a way to debug the encoder function in Lora-app-server? What I would like to see is the array being returned to confirm the encoder properly encoded the object.
There will be a new release soon where encoder / decoder errors are being logged to the MQTT /error topic and are also visible in the web-interface when opening the live events tab on the device details