Hi!
I’m puzzled to see that frames are displayed fine on the “LIVE LORAWAN FRAMES” tab in the gateway, but, in the devices, I get the error “Not connected to Websocket API” in the tabs “Device Data” and “LoRaWAN Frames”; the error message quickly shows up and then disappears; hard to capture in the screenshots below.
I’ve been reading some posts and suggestions are to make sure to be using redis 5.0 (I’m using the docker image “redis:5-alpine”). The other suggestion is to check my HAproxy configuration. Aside from these fix suggestions, why would it work for the gateway frames and not the device frames? It looks to me that the 2 issues (redis and proxy) would affect all frames display
I’ve tested with chrome, Internet explorer and firefox
Note: I’m not seeing any received data in the devices yet, that’s why I was trying to look at possible errors in “Device Data” tab.
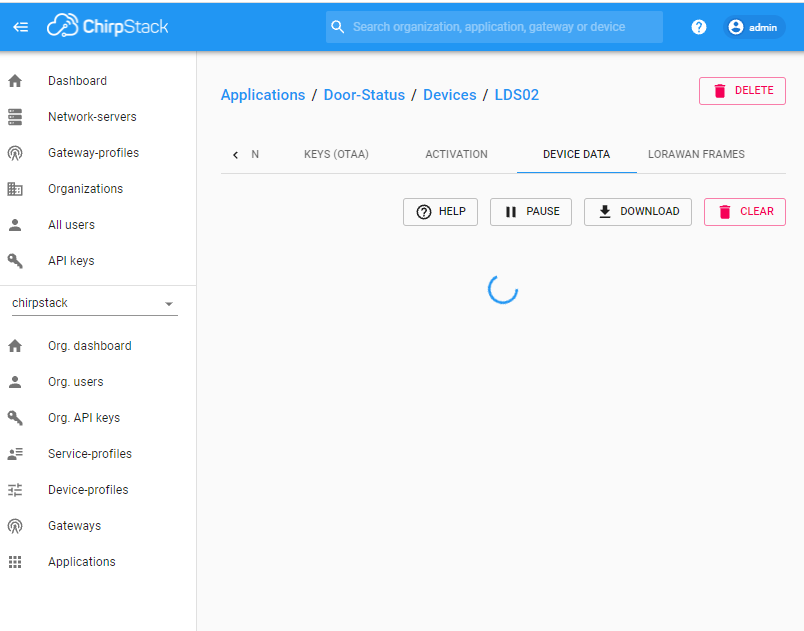
Looks like it can connect to the api website, but then it just disconnects without showing anything:

These are the frames from the gateway. They look fine:

Any help is much appreciated!
Abel
 The device hadn’t joined the network yet! It’s working now!