No communication with LoRa node post setup

Greetings,
The lora-app-server UI works perfectly well which enabled me for creation of network server , service profie, device profile and to some extent application along with addition of device.

The problem:
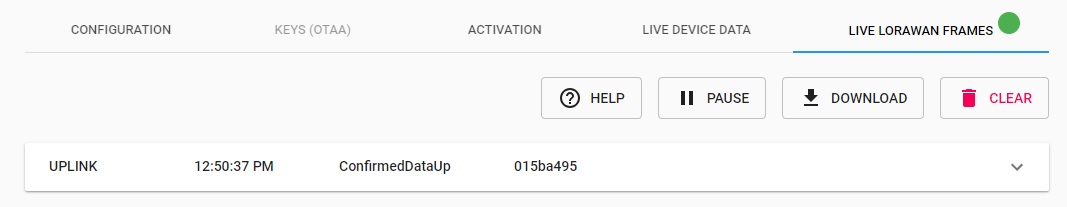
I cannot receive any message from lora node (RAK 811) however it does receive a message(confirmation message) after transmission of data

Output @ LoRa node based on ABP configuration set using https://localhost:80808

at+mode=0
OK

at+set_config=dev_addr:XXXXXXXX&nwks_key:yyyyyyyyyyyyyyyyyyyyyyyyyyyyyyyy&apps_key:zzzzzzzzzzzzzzzzzzzzzzzzzzzzzzzz
OK

dev_addr, nwks_key and apps_key generated at the localhost:8080

at+join=abp
OK

at+send=0,2,000000000000007F0000000000000000
OK
at+recv=2,0,0

LOG at journalctl -u lora-app-server -f

Sep 04 07:52:54 Beaglebone systemd[1]: Started LoRa App Server.
Sep 04 07:52:54 Beaglebone lora-app-server[29460]: time=“2018-09-04T07:52:54Z” level=info msg=“starting LoRa App Server” docs=“https://www.loraserver.io/” version=2.0.1
Sep 04 07:52:54 Beaglebone lora-app-server[29460]: time=“2018-09-04T07:52:54Z” level=info msg=“connecting to postgresql”
Sep 04 07:52:54 Beaglebone lora-app-server[29460]: time=“2018-09-04T07:52:54Z” level=info msg=“setup redis connection pool”
Sep 04 07:52:54 Beaglebone lora-app-server[29460]: time=“2018-09-04T07:52:54Z” level=info msg=“handler/mqtt: TLS config is empty”
Sep 04 07:52:54 Beaglebone lora-app-server[29460]: time=“2018-09-04T07:52:54Z” level=info msg=“handler/mqtt: connecting to mqtt broker” server=“tcp://localhost:1883”
Sep 04 07:52:54 Beaglebone lora-app-server[29460]: time=“2018-09-04T07:52:54Z” level=info msg=“applying database migrations”
Sep 04 07:52:54 Beaglebone lora-app-server[29460]: time=“2018-09-04T07:52:54Z” level=info msg=“handler/mqtt: connected to mqtt broker”
Sep 04 07:52:54 Beaglebone lora-app-server[29460]: time=“2018-09-04T07:52:54Z” level=info msg=“handler/mqtt: subscribing to tx topic” qos=0 topic=application/+/device/+/tx
Sep 04 07:52:54 Beaglebone lora-app-server[29460]: time=“2018-09-04T07:52:54Z” level=info msg=“migrations applied” count=0
Sep 04 07:52:54 Beaglebone lora-app-server[29460]: time=“2018-09-04T07:52:54Z” level=info msg=“starting application-server api” bind=“0.0.0.0:8001” ca-cert=/home/machinekit/loraserver-certificates-master/certs/ca/ca.pem tls-cert=/home/machinekit/loraserver-certificates-master/certs/lora-app-server/api/server/lora-app-server-api-server.pem tls-key=/home/machinekit/loraserver-certificates-master/certs/lora-app-server/api/server/lora-app-server-api-server-key.pem
Sep 04 07:52:54 Beaglebone lora-app-server[29460]: time=“2018-09-04T07:52:54Z” level=info msg=“starting join-server api” bind=“0.0.0.0:8003” ca_cert=/home/machinekit/loraserver-certificates-master/certs/ca/ca.pem tls_cert=/home/machinekit/loraserver-certificates-master/certs/lora-app-server/join-api/server/lora-app-server-join-api-server.pem tls_key=/home/machinekit/loraserver-certificates-master/certs/lora-app-server/join-api/server/lora-app-server-join-api-server-key.pem
Sep 04 07:52:54 Beaglebone lora-app-server[29460]: time=“2018-09-04T07:52:54Z” level=info msg=“starting client api server” bind=“0.0.0.0:8080” tls-cert=/etc/lora-app-server/certs/http.pem tls-key=/etc/lora-app-server/certs/http-key.pem
Sep 04 07:52:55 Beaglebone lora-app-server[29460]: time=“2018-09-04T07:52:55Z” level=info msg=“registering rest api handler and documentation endpoint” path=/api

LOG upon activation of the device:

Sep 04 07:54:24 Beaglebone lora-app-server[29460]: time=“2018-09-04T07:54:24Z” level=info msg=“device-activation created” dev_eui=**************** id=7
Sep 04 07:54:24 Beaglebone lora-app-server[29460]: time=“2018-09-04T07:54:24Z” level=info msg=“device activated” dev_addr=XXXXXXXX dev_eui=****************
Sep 04 07:54:24 Beaglebone lora-app-server[29460]: time=“2018-09-04T07:54:24Z” level=info msg=“finished unary call with code OK” grpc.code=OK grpc.method=Activate grpc.service=api.DeviceService grpc.start_time=“2018-09-04T07:54:24Z” grpc.time_ms=280.709 peer.address="[::1]:59011" span.kind=server system=grpc
Sep 04 07:54:25 Beaglebone lora-app-server[29460]: time=“2018-09-04T07:54:25Z” level=info msg=“finished unary call with code OK” grpc.code=OK grpc.method=Get grpc.service=api.ApplicationService grpc.start_time=“2018-09-04T07:54:25Z” grpc.time_ms=103.323 peer.address="[::1]:59009" span.kind=server system=grpc
Sep 04 07:54:25 Beaglebone lora-app-server[29460]: time=“2018-09-04T07:54:25Z” level=info msg=“finished unary call with code OK” grpc.code=OK grpc.method=List grpc.service=api.DeviceService grpc.start_time=“2018-09-04T07:54:25Z” grpc.time_ms=119.498 peer.address="[::1]:59011" span.kind=server system=grpc

Am I missing something?

Please check the loraserver logs. Nothing in the above logs relate to the received frame from your device. You also might want to check this guide: https://www.loraserver.io/lora-gateway-bridge/install/debug/.

And can you see an uplink going through your gateway ?

I apologise for my delayed response and thank you for replying , @brocaar @Clement

No I cannot see the uplink.
And for some reason Im failing to understand I cant start my lora concentrator(RAK 831) as suggested in setup guide I have linked the packet forwarder to the working RAK831 lora_gateway and made packet_forwarder as service.

I can see the frame counter when I run test_loragw_hal located at /libloragw which prior to packet forwarder installation didnt exist.

Sending packet #94, rf path 0, return 0
status -> 2:
TX finished
d9.40.0.0.0.0.0.5.0.9a.14.1.0.6.0.0.54.58.2e.54.45.53.54.2e.4c.4f.52.41.2e.47.57.2e.0.0.0.5f.end
+++
output I get when I run test_loragw_hal However I can only see the Rx led on glow once upon startup and then doesnt blink which was not the case prior to installation of packet forwarder.(May mean that I have messed up with something here too).

The loraserver , lora-app-server and packet-forwarder are running as services although packet forwarder tries to restart almost everytime stating failed to start concentrator so I went in for /opt/semtech/packet-forwarder/lora_pkt_fwd and after manually reseting the my concentrator I ran ./lora_pkt_fwd which gave me following log:

*** Beacon Packet Forwarder for Lora Gateway ***
Version: 1.5.0
*** Lora concentrator HAL library version info ***
Version: 5.0.1;


INFO: Little endian host
INFO: found global configuration file global_conf.json, parsing it
INFO: global_conf.json does contain a JSON object named SX1301_conf, parsing SX1301 parameters
INFO: lorawan_public 1, clksrc 1
INFO: no configuration for LBT
INFO: antenna_gain 0 dBi
INFO: Configuring TX LUT with 16 indexes
INFO: radio 0 enabled (type SX1257), center frequency 867500000, RSSI offset -166.000000, tx enabled 1, tx_notch_freq 0
INFO: radio 1 enabled (type SX1257), center frequency 868500000, RSSI offset -166.000000, tx enabled 0, tx_notch_freq 0
INFO: Lora multi-SF channel 0> radio 1, IF -400000 Hz, 125 kHz bw, SF 7 to 12
INFO: Lora multi-SF channel 1> radio 1, IF -200000 Hz, 125 kHz bw, SF 7 to 12
INFO: Lora multi-SF channel 2> radio 1, IF 0 Hz, 125 kHz bw, SF 7 to 12
INFO: Lora multi-SF channel 3> radio 0, IF -400000 Hz, 125 kHz bw, SF 7 to 12
INFO: Lora multi-SF channel 4> radio 0, IF -200000 Hz, 125 kHz bw, SF 7 to 12
INFO: Lora multi-SF channel 5> radio 0, IF 0 Hz, 125 kHz bw, SF 7 to 12
INFO: Lora multi-SF channel 6> radio 0, IF 200000 Hz, 125 kHz bw, SF 7 to 12
INFO: Lora multi-SF channel 7> radio 0, IF 400000 Hz, 125 kHz bw, SF 7 to 12
INFO: Lora std channel> radio 1, IF -200000 Hz, 250000 Hz bw, SF 7
INFO: FSK channel> radio 1, IF 300000 Hz, 125000 Hz bw, 50000 bps datarate
INFO: global_conf.json does contain a JSON object named gateway_conf, parsing gateway parameters
INFO: gateway MAC address is configured to XXXXXXXXXXXXXXX
INFO: server hostname or IP address is configured to “192.168.7.2”
INFO: upstream port is configured to “1700”
INFO: downstream port is configured to “1700”
INFO: downstream keep-alive interval is configured to 10 seconds
INFO: statistics display interval is configured to 30 seconds
INFO: upstream PUSH_DATA time-out is configured to 100 ms
INFO: packets received with a valid CRC will be forwarded
INFO: packets received with a CRC error will NOT be forwarded
INFO: packets received with no CRC will NOT be forwarded
INFO: found local configuration file local_conf.json, parsing it
INFO: redefined parameters will overwrite global parameters
INFO: local_conf.json does not contain a JSON object named SX1301_conf
INFO: local_conf.json does contain a JSON object named gateway_conf, parsing gateway parameters
INFO: gateway MAC address is configured to XXXXXXXXXXXXXXX
INFO: packets received with a valid CRC will be forwarded
INFO: packets received with a CRC error will NOT be forwarded
INFO: packets received with no CRC will NOT be forwarded
ERROR: [main] failed to start the concentrator

I have configured local_conf.json as follow:

{
/* Put there parameters that are different for each gateway (eg. pointing one g$
/* Settings defined in global_conf will be overwritten by those in local_conf /
“gateway_conf”: {
“gateway_ID”: “XXXXXXXXXXXXXXX” /
you must pick a unique 64b number f$
}
}

and the global_conf.json is set as EU868 and with same gatway ID

mosquitto_sub -v -t “gateway/+/rx” //I am getting no log for this upon usage

journalctl -f -n 100 -u lora-gateway-bridge //Same for this no log

sudo tcpdump -AUq -i lo port 1700 //Same of this too

I have install lora-gateway-bridge, loragateway and packetforwarder too…

Where shoud I start from to fix this problem?

You’re problem is clearly coming from your gateway.

You have no log in server part because you don’t forward any message from your “offline” gateway.

Can you paste your global_conf.json file here ?

@Clement thanks for replying

global_conf.json at packet-forwarder:

{
“SX1301_conf”: {
“lorawan_public”: true,
“clksrc”: 1, /* radio_1 provides clock to concentrator /
“antenna_gain”: 0, /
antenna gain, in dBi /
“radio_0”: {
“enable”: true,
“type”: “SX1257”,
“freq”: 867500000,
“rssi_offset”: -166.0,
“tx_enable”: true,
“tx_freq_min”: 863000000,
“tx_freq_max”: 870000000
},
“radio_1”: {
“enable”: true,
“type”: “SX1257”,
“freq”: 868500000,
“rssi_offset”: -166.0,
“tx_enable”: false
},
“chan_multiSF_0”: {
/
Lora MAC channel, 125kHz, all SF, 868.1 MHz /
“enable”: true,
“radio”: 1,
“if”: -400000
},
“chan_multiSF_1”: {
/
Lora MAC channel, 125kHz, all SF, 868.3 MHz /
“enable”: true,
“radio”: 1,
“if”: -200000
},
“chan_multiSF_2”: {
/
Lora MAC channel, 125kHz, all SF, 868.5 MHz /
“enable”: true,
“radio”: 1,
“if”: 0
},
“chan_multiSF_3”: {
/
Lora MAC channel, 125kHz, all SF, 867.1 MHz /
“enable”: true,
“radio”: 0,
“if”: -400000
},
“chan_multiSF_4”: {
/
Lora MAC channel, 125kHz, all SF, 867.3 MHz /
“enable”: true,
“radio”: 0,
“if”: -200000
},
“chan_multiSF_5”: {
/
Lora MAC channel, 125kHz, all SF, 867.5 MHz /
“enable”: true,
“radio”: 0,
“if”: 0
},
“chan_multiSF_6”: {
/
Lora MAC channel, 125kHz, all SF, 867.7 MHz /
“enable”: true,
“radio”: 0,
“if”: 200000
},
“chan_multiSF_7”: {
/
Lora MAC channel, 125kHz, all SF, 867.9 MHz /
“enable”: true,
“radio”: 0,
“if”: 400000
},
“chan_Lora_std”: {
/
Lora MAC channel, 250kHz, SF7, 868.3 MHz /
“enable”: true,
“radio”: 1,
“if”: -200000,
“bandwidth”: 250000,
“spread_factor”: 7
},
“chan_FSK”: {
/
FSK 50kbps channel, 868.8 MHz /
“enable”: true,
“radio”: 1,
“if”: 300000,
“bandwidth”: 125000,
“datarate”: 50000
},
“tx_lut_0”: {
/
TX gain table, index 0 /
“pa_gain”: 0,
“mix_gain”: 8,
“rf_power”: -6,
“dig_gain”: 0
},
“tx_lut_1”: {
/
TX gain table, index 1 /
“pa_gain”: 0,
“mix_gain”: 10,
“rf_power”: -3,
“dig_gain”: 0
},
“tx_lut_2”: {
/
TX gain table, index 2 /
“pa_gain”: 0,
“mix_gain”: 12,
“rf_power”: 0,
“dig_gain”: 0
},
“tx_lut_3”: {
/
TX gain table, index 3 /
“pa_gain”: 1,
“mix_gain”: 8,
“rf_power”: 3,
“dig_gain”: 0
},
“tx_lut_4”: {
/
TX gain table, index 4 /
“pa_gain”: 1,
“mix_gain”: 10,
“rf_power”: 6,
“dig_gain”: 0
},
“tx_lut_5”: {
/
TX gain table, index 5 /
“pa_gain”: 1,
“mix_gain”: 12,
“rf_power”: 10,
“dig_gain”: 0
},
“tx_lut_6”: {
/
TX gain table, index 6 /
“pa_gain”: 1,
“mix_gain”: 13,
“rf_power”: 11,
“dig_gain”: 0
},
“tx_lut_7”: {
/
TX gain table, index 7 /
“pa_gain”: 2,
“mix_gain”: 9,
“rf_power”: 12,
“dig_gain”: 0
},
“tx_lut_8”: {
/
TX gain table, index 8 /
“pa_gain”: 1,
“mix_gain”: 15,
“rf_power”: 13,
“dig_gain”: 0
},
“tx_lut_9”: {
/
TX gain table, index 9 /
“pa_gain”: 2,
“mix_gain”: 10,
“rf_power”: 14,
“dig_gain”: 0
},
“tx_lut_10”: {
/
TX gain table, index 10 /
“pa_gain”: 2,
“mix_gain”: 11,
“rf_power”: 16,
“dig_gain”: 0
},
“tx_lut_11”: {
/
TX gain table, index 11 /
“pa_gain”: 3,
“mix_gain”: 9,
“rf_power”: 20,
“dig_gain”: 0
},
“tx_lut_12”: {
/
TX gain table, index 12 /
“pa_gain”: 3,
“mix_gain”: 10,
“rf_power”: 23,
“dig_gain”: 0
},
“tx_lut_13”: {
/
TX gain table, index 13 /
“pa_gain”: 3,
“mix_gain”: 11,
“rf_power”: 25,
“dig_gain”: 0
},
“tx_lut_14”: {
/
TX gain table, index 14 /
“pa_gain”: 3,
“mix_gain”: 12,
“rf_power”: 26,
“dig_gain”: 0
},
“tx_lut_15”: {
/
TX gain table, index 15 */
“pa_gain”: 3,
“mix_gain”: 14,
“rf_power”: 27,
“dig_gain”: 0
}
},

"gateway_conf": {
    "gateway_ID": "XXXXXXXXXXXXXXXX",
    /* change with default server address/ports, or overwrite in local_conf.json */
    "server_address": "localhost",
    "serv_port_up": 1700,
    "serv_port_down": 1700,
    /* adjust the following parameters for your network */
    "keepalive_interval": 10,
    "stat_interval": 30,
    "push_timeout_ms": 100,
    /* forward only valid packets */
    "forward_crc_valid": true,
    "forward_crc_error": false,
    "forward_crc_disabled": false
}

}

@Clement
I did manage to run packet forwarder (/opt/semtech/packet_forwarder/lora_pkt_fwd/lora_pkt_fwd) and it runs perfectly too the Rx led of the RAK 831 board is up and it can receive the message from RAK 811 however:

at+mode=0
OK

at+set_config=dev_addr:ZZZZZZZZ&nwks_key:YYYYYYYYYYYYYYYYYYYYYYYYYYYYYYYY&apps_key:XXXXXXXXXXXXXXXXXXXXXXXXXXXXXXXX
OK

at+join=abp
OK

at+send=0,2,000000000000007F0000000000000000

OK

at+recv=2,0,0

this is what I get at the UI

and then if I go for confirmed uplink

at+send=1,2,000000000000007F0000000000000000

I reveive the confirmation after a dealy of like 5-6mins
and no data at live device data

and this mosquitto_sub -t “gateway/#” -v gives
gateway/e8eb11fffe254cf9/stats {“mac”:“e8eb11fffe254cf9”,“time”:“2018-09-11T11:4 7:22Z”,“rxPacketsReceived”:0,“rxPacketsReceivedOK”:0,“txPacketsReceived”:0,“txPa cketsEmitted”:0}
gateway/e8eb11fffe254cf9/config {“mac”:“e8eb11fffe254cf9”,“version”:“2018-08-30T 11:07:17.578992Z”,“channels”:[{“modulation”:“LORA”,“frequency”:868100000,“bandwi dth”:125,“spreadingFactors”:[7,8,9,10,11,12]}]}
gateway/e8eb11fffe254cf9/stats {“mac”:“e8eb11fffe254cf9”,“time”:“2018-09-11T11:4 7:52Z”,“rxPacketsReceived”:1,“rxPacketsReceivedOK”:0,“txPacketsReceived”:0,“txPa cketsEmitted”:0}
gateway/e8eb11fffe254cf9/config {“mac”:“e8eb11fffe254cf9”,“version”:“2018-08-30T 11:07:17.578992Z”,“channels”:[{“modulation”:“LORA”,“frequency”:868100000,“bandwi dth”:125,“spreadingFactors”:[7,8,9,10,11,12]}]}
gateway/e8eb11fffe254cf9/stats {“mac”:“e8eb11fffe254cf9”,“time”:“2018-09-11T11:4 8:22Z”,“rxPacketsReceived”:0,“rxPacketsReceivedOK”:0,“txPacketsReceived”:0,“txPa cketsEmitted”:0}
gateway/e8eb11fffe254cf9/config {“mac”:“e8eb11fffe254cf9”,“version”:“2018-08-30T 11:07:17.578992Z”,“channels”:[{“modulation”:“LORA”,“frequency”:868100000,“bandwi dth”:125,“spreadingFactors”:[7,8,9,10,11,12]}]}
and so onn…

journalctl -f -n 100 -u loragateway-bridge

root@Beaglebone:/home/machinekit# journalctl -u lora-gateway-bridge -f -n 50
– Logs begin at Tue 2018-09-11 12:00:35 UTC. –
Sep 11 12:03:22 Beaglebone lora-gateway-bridge[2417]: time="2018-09-11T12:03:22Z " level=info msg=“backend: config packet received” topic=gateway/e8eb11fffe254cf 9/config
Sep 11 12:03:22 Beaglebone lora-gateway-bridge[2417]: time="2018-09-11T12:03:22Z " level=warning msg=“gateway: configuration was not applied, gateway is not conf igured for managed configuration” mac=e8eb11fffe254cf9
Sep 11 12:03:31 Beaglebone lora-gateway-bridge[2417]: time="2018-09-11T12:03:31Z " level=debug msg=“gateway: received udp packet from gateway” addr=“127.0.0.1:46 354” protocol_version=2 type=PullData
Sep 11 12:03:31 Beaglebone lora-gateway-bridge[2417]: time="2018-09-11T12:03:31Z " level=debug msg=“gateway: sending udp packet to gateway” addr="127.0.0.1:46354 " protocol_version=2 type=PullACK
Sep 11 12:03:41 Beaglebone lora-gateway-bridge[2417]: time="2018-09-11T12:03:41Z " level=debug msg=“gateway: received udp packet from gateway” addr=“127.0.0.1:46 354” protocol_version=2 type=PullData
Sep 11 12:03:41 Beaglebone lora-gateway-bridge[2417]: time="2018-09-11T12:03:41Z " level=debug msg=“gateway: sending udp packet to gateway” addr="127.0.0.1:46354 " protocol_version=2 type=PullACK

journalctl -u loraserver -f -n 50

Sep 11 16:16:21 Beaglebone loraserver[2395]: time=“2018-09-11T16:16:21Z” level=e rror msg=“finished unary call with code Unknown” error=“rpc error: code = Unknow n desc = lorawan/band: invalid data-rate” grpc.code=Unknown grpc.method=SendProp rietaryPayload grpc.service=ns.NetworkServerService grpc.start_time=“2018-09-11T 16:16:21Z” grpc.time_ms=0.446 peer.address=“192.168.7.2:53697” span.kind=server system=grpc
Sep 11 16:16:22 Beaglebone loraserver[2395]: time=“2018-09-11T16:16:22Z” level=e rror msg=“finished unary call with code Unknown” error=“rpc error: code = Unknow n desc = lorawan/band: invalid data-rate” grpc.code=Unknown grpc.method=SendProp rietaryPayload grpc.service=ns.NetworkServerService grpc.start_time=“2018-09-11T 16:16:22Z” grpc.time_ms=0.233 peer.address=“192.168.7.2:53697” span.kind=server system=grpc
Sep 11 16:16:23 Beaglebone loraserver[2395]: time=“2018-09-11T16:16:23Z” level=e rror msg=“finished unary call with code Unknown” error=“rpc error: code = Unknow n desc = lorawan/band: invalid data-rate” grpc.code=Unknown grpc.method=SendProp rietaryPayload grpc.service=ns.NetworkServerService grpc.start_time=“2018-09-11T 16:16:23Z” grpc.time_ms=0.541 peer.address=“192.168.7.2:53697” span.kind=server system=grpc

journalctl -u lora-app-server -f -n 50
Sep 11 16:36:35 Beaglebone lora-app-server[3170]: time=“2018-09-11T16:36:34Z” le vel=info msg=“gateway ping created” dr=42 frequency=867100000 gateway_mac=XXXXXXXXXXXXXXXX id=151976
Sep 11 16:36:35 Beaglebone lora-app-server[3170]: time=“2018-09-11T16:36:35Z” le vel=error msg=“finished client unary call” error=“rpc error: code = Unknown desc = lorawan/band: invalid data-rate” grpc.code=Unknown grpc.method=SendProprietar yPayload grpc.service=ns.NetworkServerService grpc.time_ms=8.527 span.kind=clien t system=grpc
Sep 11 16:36:35 Beaglebone lora-app-server[3170]: time=“2018-09-11T16:36:35Z” le vel=error msg=“send gateway ping error: send ping error: send proprietary payloa d error: rpc error: code = Unknown desc = lorawan/band: invalid data-rate”
Sep 11 16:36:36 Beaglebone lora-app-server[3170]: time=“2018-09-11T16:36:36Z” le vel=debug msg=“sql query executed” args="[]" duration=21.877667ms query="\n\t\ts elect\n\t\t\tg.*\n\t\tfrom gateway g\n\t\tinner join network_server ns\n\t\t\ton ns.id = g.network_server_id\n\t\twhere\n\t\t\tns.gateway_discovery_enabled = tr ue\n\t\t\tand g.ping = true\n\t\t\tand (g.last_ping_sent_at is null or g.last_pi ng_sent_at <= (now() - (interval ‘24 hours’ / ns.gateway_discovery_interval)))\n \t\torder by last_ping_sent_at\n\t\tlimit 1\n\t\tfor update"
Sep 11 16:36:36 Beaglebone lora-app-server[3170]: time=“2018-09-11T16:36:36Z” le vel=debug msg=“sql query executed” args="[143]" duration=7.556542ms query=“selec t * from network_server where id = $1”
Sep 11 16:36:36 Beaglebone lora-app-server[3170]: time=“2018-09-11T16:36:36Z” le vel=debug msg=“sql query executed” args="[2018-09-11 16:36:36.053598375 +0000 UT C m=+12473.668454990 [232 235 17 255 254 37 76 249] 867100000 42]" duration=7.56 7375ms query="\n\t\tinsert into gateway_ping (\n\t\t\tcreated_at,\n\t\t\tgateway _mac,\n\t\t\tfrequency,\n\t\t\tdr\n\t\t) values ($1, $2, $3, $4)\n\t\treturning id"

this doesnt work yet sudo tcpdump -AUq -i lo port 1700

So where am I deviating now ?