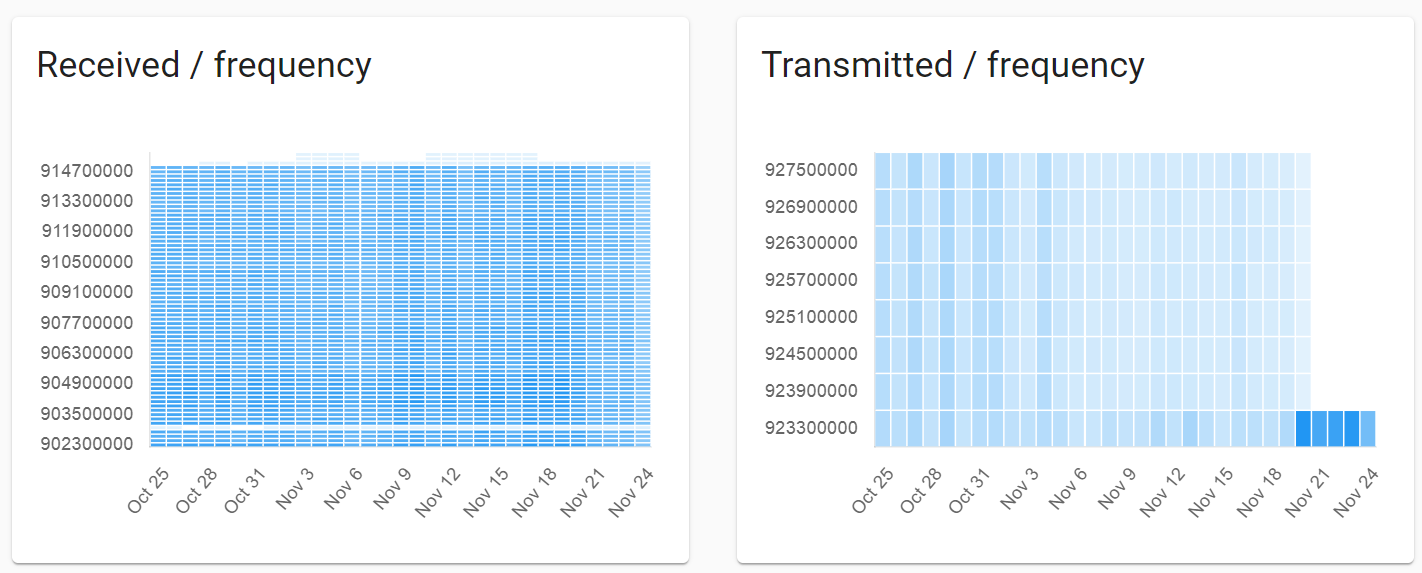
On the UI it looks like the RX window was switched form RX1 to RX2. What about this white horizontal line in the Received / frequency graph, do you think there is severe noise on that frequency near the gateway and it can’t receive anything on it?
For my second question I’m looking at latency between the DL being sent to the gateway and the ACK coming back. Usually this is about 200ms give or take but sometimes I’m seeing 3 seconds and more. I try to differentiate between data downlinks (all devices are Class-C) and join-accepts but I’m not that good yet with the LoRa frames. Is it feasible that there is a priority setting where join-accepts are kept at a very low latency and regular class-C downlinks may not be taken care of for several seconds, in which case this might be normal or should I be concerned at seeing such high latencies at all?
Does the gateway respond with the ACK as soon as the DL request is received from CS or does it only send the ACK after the DL is actually transmitted?
Looking at the ACK, I suppose status ok means it was already transmitted and on-time?
{“gatewayID”:"///////////=",“token”:21793,“error”:"",“downlinkID”:“VSFC1W5dRai75lSpwNr5+Q==”,“items”:[{“status”:“OK”}