No response to ConfirmedDataUp

Hi there,

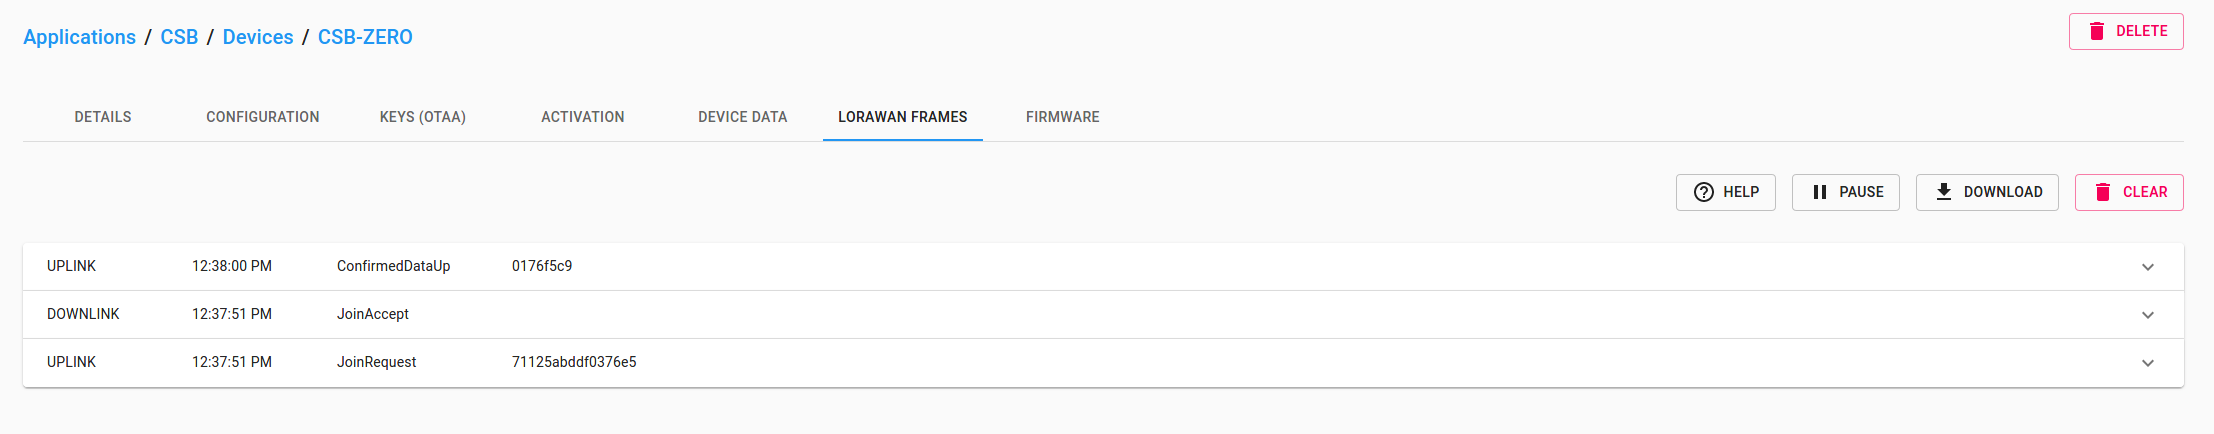
I’m really new to LoRa, so i apologize if making a dumb question. I’m using a Class A end-node, with OTAA, which timeouts waiting for an acknowledgement message to the sent ConfirmedDataUp message. When looking to the lorawan’s frames logs it is kind obvious that the server is not sending the ack message, my question is why?

[
{
    "uplinkMetaData": {
        "rxInfo": [
            {
                "gatewayID": "uCfr//51IJw=",
                "time": null,
                "timeSinceGPSEpoch": null,
                "rssi": -75,
                "loRaSNR": 10.5,
                "channel": 0,
                "rfChain": 1,
                "board": 0,
                "antenna": 0,
                "location": {
                    "latitude": CENSURED,
                    "longitude": CENSURED,
                    "altitude": 0,
                    "source": "UNKNOWN",
                    "accuracy": 0
                },
                "fineTimestampType": "NONE",
                "context": "UDnG7A==",
                "uplinkID": "XAG4zp4sSqmRF55WYYCZhg==",
                "crcStatus": "CRC_OK"
            }
        ],
        "txInfo": {
            "frequency": 868100000,
            "modulation": "LORA",
            "loRaModulationInfo": {
                "bandwidth": 125,
                "spreadingFactor": 12,
                "codeRate": "4/5",
                "polarizationInversion": false
            }
        }
    },
    "phyPayload": {
        "mhdr": {
            "mType": "ConfirmedDataUp",
            "major": "LoRaWANR1"
        },
        "macPayload": {
            "fhdr": {
                "devAddr": "0176f5c9",
                "fCtrl": {
                    "adr": false,
                    "adrAckReq": false,
                    "ack": false,
                    "fPending": false,
                    "classB": false
                },
                "fCnt": 1,
                "fOpts": null
            },
            "fPort": 2,
            "frmPayload": [
                {
                    "bytes": "xQM5qBj6G0q56g=="
                }
            ]
        },
        "mic": "00732b5e"
    }
},
{
    "downlinkMetaData": {
        "gatewayID": "b827ebfffe75209c",
        "txInfo": {
            "frequency": 868100000,
            "power": 14,
            "modulation": "LORA",
            "loRaModulationInfo": {
                "bandwidth": 125,
                "spreadingFactor": 12,
                "codeRate": "4/5",
                "polarizationInversion": true
            },
            "board": 0,
            "antenna": 0,
            "timing": "DELAY",
            "delayTimingInfo": {
                "delay": "5s"
            },
            "context": "T7qXbA=="
        }
    },
    "phyPayload": {
        "mhdr": {
            "mType": "JoinAccept",
            "major": "LoRaWANR1"
        },
        "macPayload": {
            "bytes": "P2lkYTRcqtS3jqlGr9xW5i/hapEdQ9q/GaCVKQ=="
        },
        "mic": "9a09e40f"
    }
},
{
    "uplinkMetaData": {
        "rxInfo": [
            {
                "gatewayID": "uCfr//51IJw=",
                "time": null,
                "timeSinceGPSEpoch": null,
                "rssi": -77,
                "loRaSNR": 10,
                "channel": 0,
                "rfChain": 1,
                "board": 0,
                "antenna": 0,
                "location": {
                    "latitude": CENSURED,
                    "longitude": CENSURED,
                    "altitude": 0,
                    "source": "UNKNOWN",
                    "accuracy": 0
                },
                "fineTimestampType": "NONE",
                "context": "T7qXbA==",
                "uplinkID": "qZJhvFawT9+vN4eOSlTccg==",
                "crcStatus": "CRC_OK"
            }
        ],
        "txInfo": {
            "frequency": 868100000,
            "modulation": "LORA",
            "loRaModulationInfo": {
                "bandwidth": 125,
                "spreadingFactor": 12,
                "codeRate": "4/5",
                "polarizationInversion": false
            }
        }
    },
    "phyPayload": {
        "mhdr": {
            "mType": "JoinRequest",
            "major": "LoRaWANR1"
        },
        "macPayload": {
            "joinEUI": "CENSURED",
            "devEUI": "CENSURED",
            "devNonce": 5120
        },
        "mic": "60476ca1"
    }
}
]

The downlink must be acknowledged by your gateway before it shows up in the LoRaWAN frames tab (there are two receive windows with different parameters, without an ack by the gateway, ChirpStack does not know under which parameters the downlink was transmitted).

I would recommend looking at the “device data” tab for errors and looking into your gateway logs and / or configuration.

Hi brocaar,

unfortunately “device data” data remains empty. And when i see the logs by:

tail -n 1000 -f /var/log/messages | grep -E 'level=error|level=warning"

there are two messages that appear in loop:

Jul 30 13:14:22 raspberrypi3 user.warn chirpstack-network-server[900]: time="2020-07-30T13:14:22Z" level=warning msg="creating insecure application-server client" server="localhost:8001"
Jul 30 13:14:27 raspberrypi3 user.err chirpstack-network-server[900]: time="2020-07-30T13:14:27Z" level=error msg="gateway: handle gateway stats error" ctx_id=5e90addb-b4b3-4f15-96e4-3ac0772bf50f error="get application-server client error: get application-server client err

I’m using the Gateway OS, and the only change i made on the config files was to “import” them to the working directory. I’ve already tried using the configurations used by mobilefish on its “Install and configure the LoRa Server components” tutorial and the result was the same.

When searching for the messages in the log, on this forum, found this:

I tried doing what you suggested and the problem maintained. When looking for the postgre table, mentioned by zaher on that post, my table was empty.

Kind regards,
Diogo Correia